Queues:
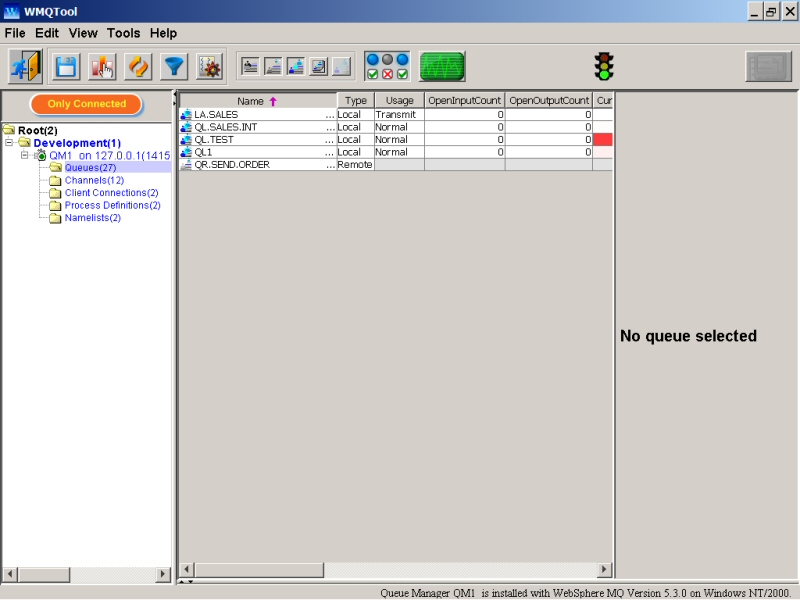
Selecting ‘Queues’ in the left window will display all the queues of that queue manager on right window.
The displayed queues are Alias
![]() ,
Local
,
Local ![]() , Model
, Model
![]() and Remote
and Remote ![]() . You may select/unselect corresponding toggle buttons
from the tool bar on the top to filter the list of the queues on right window. For example,
to view only Local queues, you may unselect Alias, Remote and Model queues. You
can also select to view Temporary Local Queues
. You may select/unselect corresponding toggle buttons
from the tool bar on the top to filter the list of the queues on right window. For example,
to view only Local queues, you may unselect Alias, Remote and Model queues. You
can also select to view Temporary Local Queues ![]() by pressing a toggle button meant
for it. Because all Temporary queues are Local queues, the toggling button for
it will be automatically deactivated when Local queues' toggling button is deactivated.
by pressing a toggle button meant
for it. Because all Temporary queues are Local queues, the toggling button for
it will be automatically deactivated when Local queues' toggling button is deactivated.
You
can also have filtered view of the queues by selecting interested queues
only.
This can be done by clicking on 'Filter' button ![]() on the toolbar at the top.
A window is displayed which allows you to select particular queues by checking
box in front of them. You may want to store this selection permanently by
clicking on 'Save settings' button
on the toolbar at the top.
A window is displayed which allows you to select particular queues by checking
box in front of them. You may want to store this selection permanently by
clicking on 'Save settings' button ![]() on the toolbar at the top so that when
you run WMQTool next time and 'Filter' button is selected
on the right top corner, it will display only those queues which
you would have selected. This filtering queues settings is stored queue
managerwise, means you can have different sets of filtered queues set for
different queue managers. Please refer to Filtering Objects for more information
on it.
on the toolbar at the top so that when
you run WMQTool next time and 'Filter' button is selected
on the right top corner, it will display only those queues which
you would have selected. This filtering queues settings is stored queue
managerwise, means you can have different sets of filtered queues set for
different queue managers. Please refer to Filtering Objects for more information
on it.
By default, System Queues (Queue
names which start with ‘SYSTEM’) are hidden. To view System Queues, select
‘System Objects’ ![]() button from the tool bar.
button from the tool bar.
If any of the buttons on Tool bar are deactivated OR any of the options on drop down popup are deactivated, it means that you are not authorized for those options. This is set thru Tools/Set Authorities. A key file or a shared file is used to provide you with your authorities. If you are the creator of that file, you will be able to modify it. If you are not the one, you can only view it or use it and you have to contact the creator of it to change your authority settings. Please refer to Setting Authorities section for more information.
In
Queue View, you can see all the properties of all the queues
in a tabular form. You can even see the queue status properties
which are not easily displayed by other tools. For example,
you can see Open Input Count and Open Output Count but cannot
see which application is connected to the queue and by whom.
WMQTool provides with one column labelled as 'InputApplications*UserId*ProcessId'
and another one as 'OutputApplications*UserId*ProcessId'.
In these columns, you can see the list of applications,
the userid under which they are running and process ids
of those applications in that server. Multiple entries are
separated by a comma. If these columns are not listed in
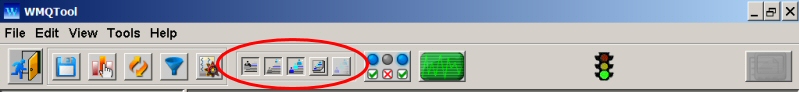
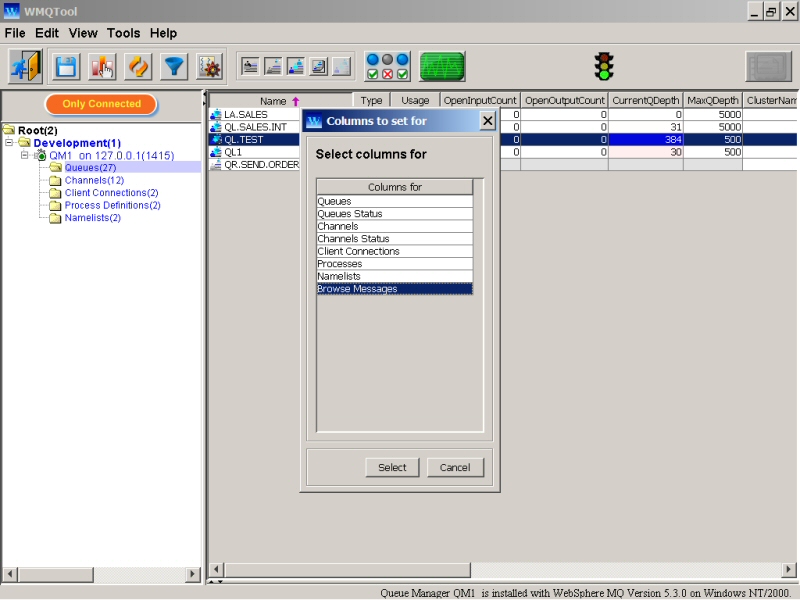
your 'Queue' view, you can add them by selecting ![]() button from the tool bar at the top.
button from the tool bar at the top.
In Queue View, you may see multiple entries of a queue if that queue is a Cluster queue. Cluster queues are listed with different hosting queue manager name.
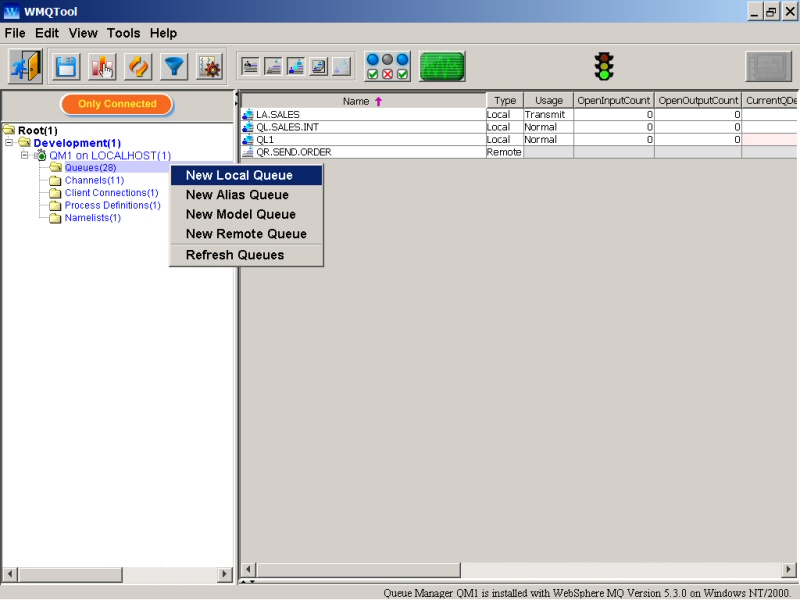
To create a new queue of any type,
|
1. |
Right click on ‘Queues’ on the left window. It will bring up a popup menu. |
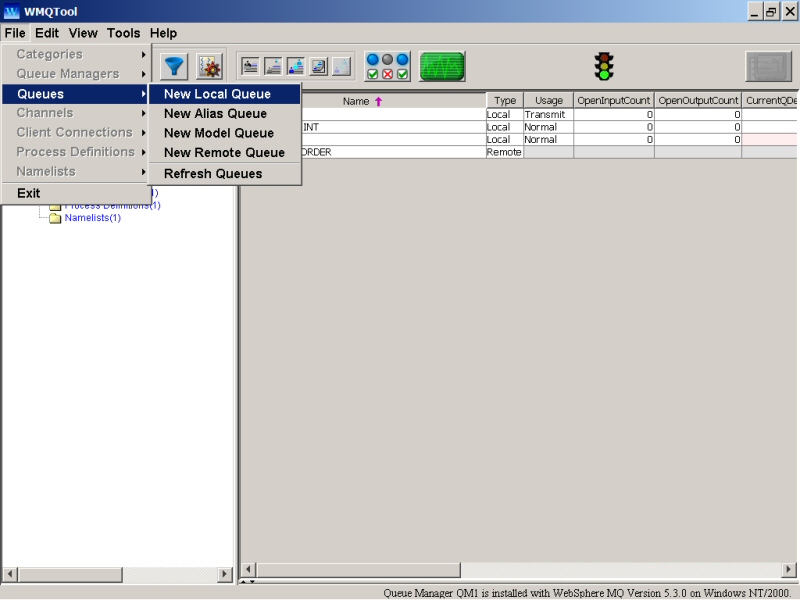
Alternatively, you can select a new queue option from File/Queues as follows.
|
2. |
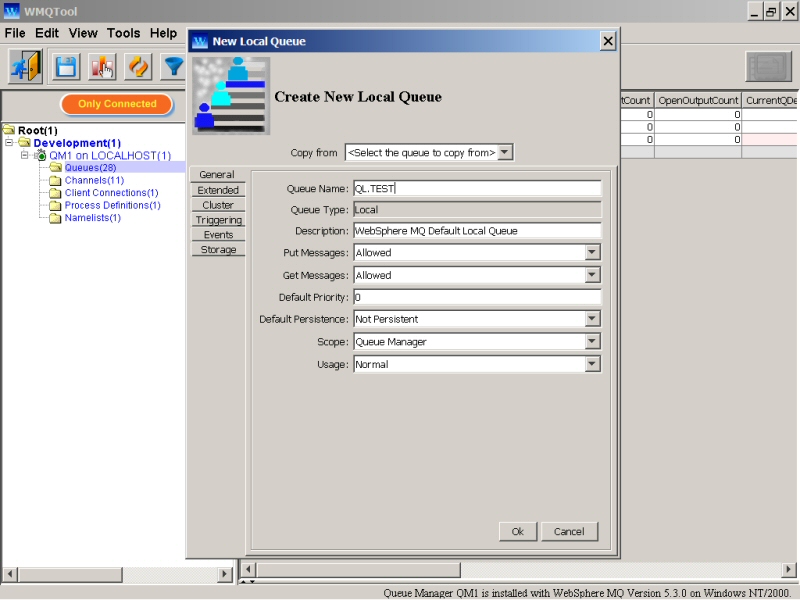
Select the queue of your desired type. It will open up a new window asking about all the properties of that type of queue with their default values. |
|
3. |
You can copy any existing queue to create a new one. When you select a queue in 'Copy from' drop down, WMQTool will copy all the properties of that queue in the new queue. Change the values of the properties if you want to and select ‘Ok’ to confirm or 'Cancel’ to abort. |
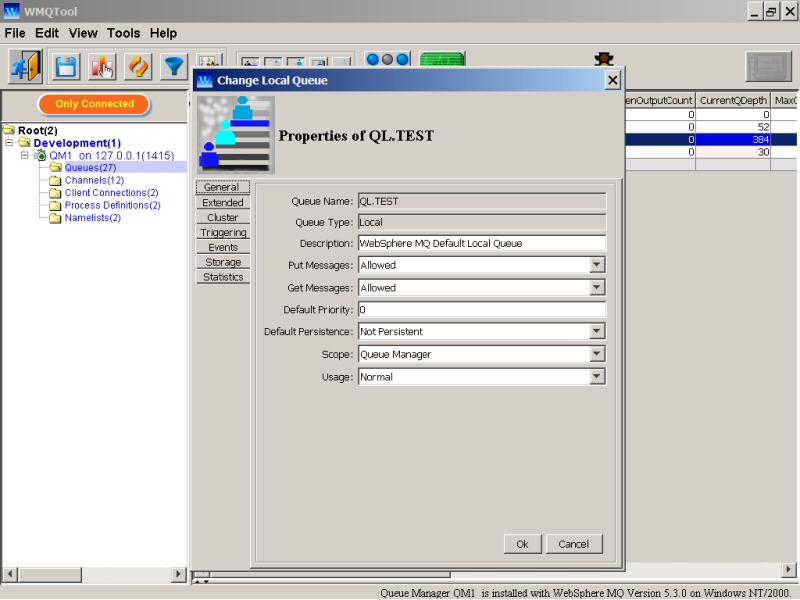
To change properties of any queue,
|
|
2. |
Click on ‘Properties’. A new window will be opened with all the current properties of that queue. |
|
3. |
Change the desired property on Properties window and click on ‘Ok’ to confirm or ‘Cancel’ to abort. |
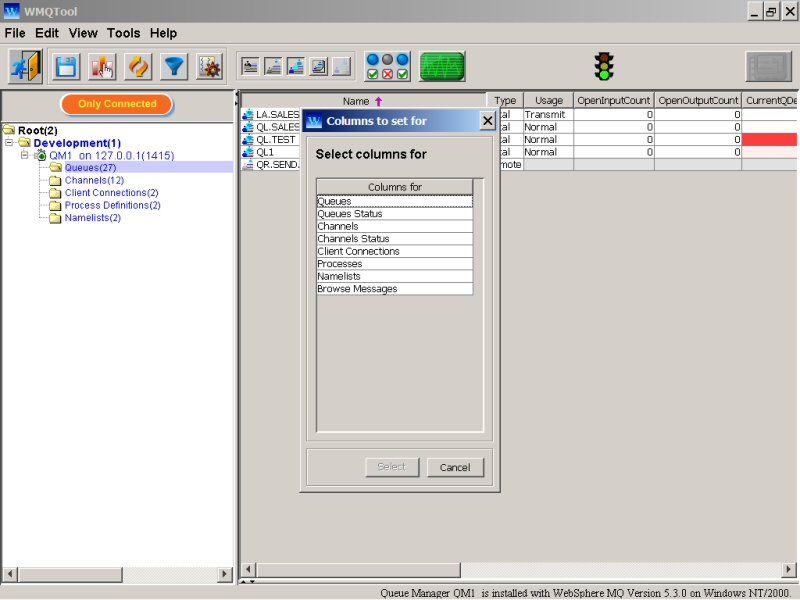
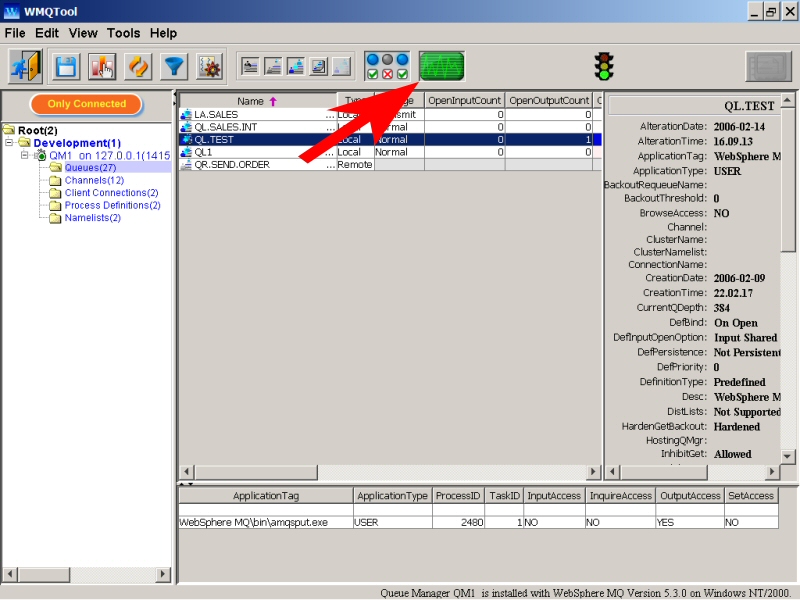
Just to view all properties of any queue (actually, any queue manager object), click on the button at the top toolbar, just as shown below.
The queue view will be divided into two parts. The right part will show you the list of all properties of the selected queue.
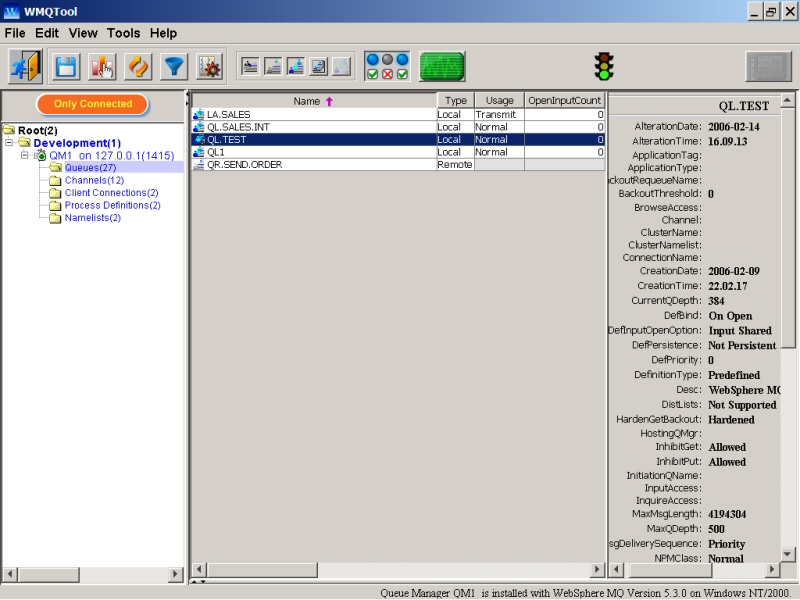
If you do not select any queue and if the Properties button is selected, it will display 'No queue selected' on the right window.
You may also want to view queue status fields of the selected queue. A window at bottom will display queue status fields. Each row indicates a connection by an application, may be for output OR input. To select other queue status fields in the view, click on the 'Select Columns' button on the toolbar at the top.
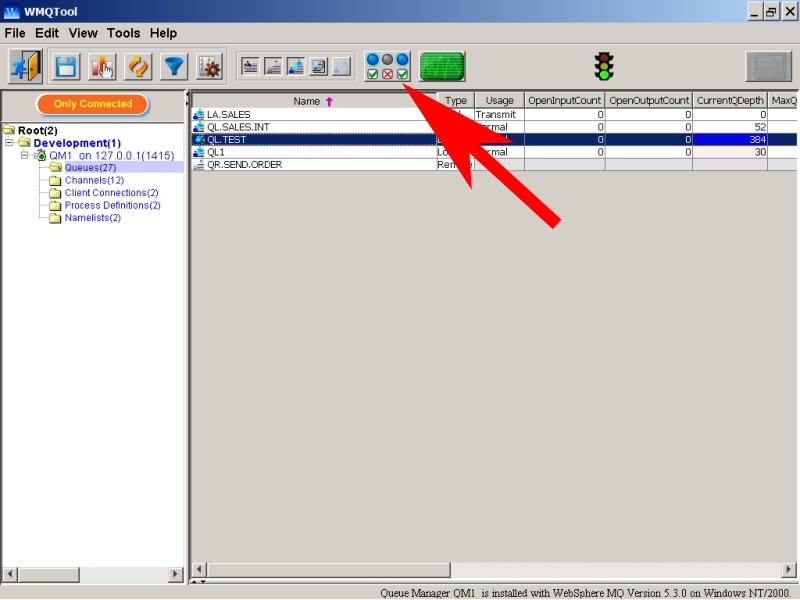
To refresh all the properties of all the queues,
You can refresh properties of all the queues three ways.
|
1. |
By right clicking on ‘Queues’… |
||||
|
|
|
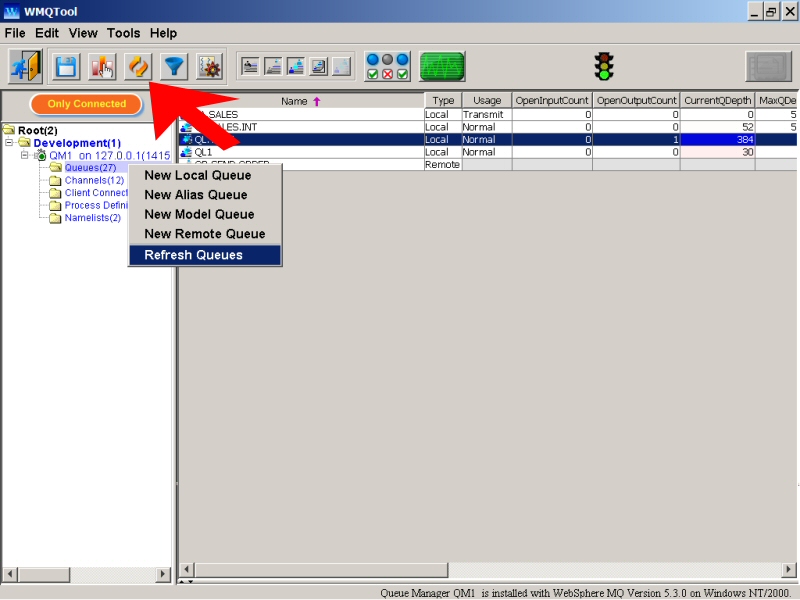
By clicking on ‘Refresh’ button on the toolbar at the top when ‘Queues’ is selected in the tree. Look at the red arrow pointing to in above snapshot.
When you select any of Refresh method, the Traffic Signal will turn red and the whole screen will freeze until all queues get refreshed. This is basically to show you that WMQTool is waiting for server response during that time. Once queues are refreshed, the signal will automatically turn green.
Following options are displayed in the popup menu.
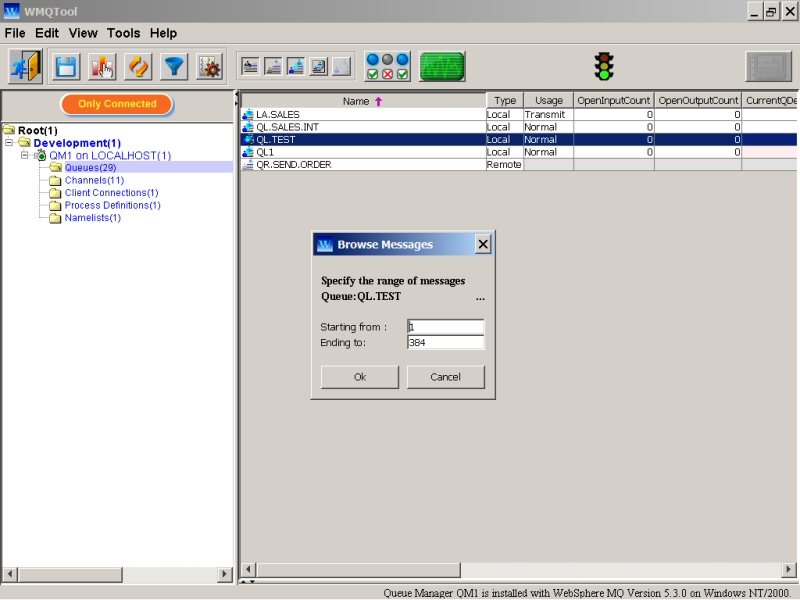
You can browse any desired range of messages of a local queue. But the range only appears if the number of messages on that queue are more than 200. If the messages are less than 200, it will not ask you the range but load all of them in Browse Messages window. If messages are more than 200, it will ask you to enter the desired range of messages like this.
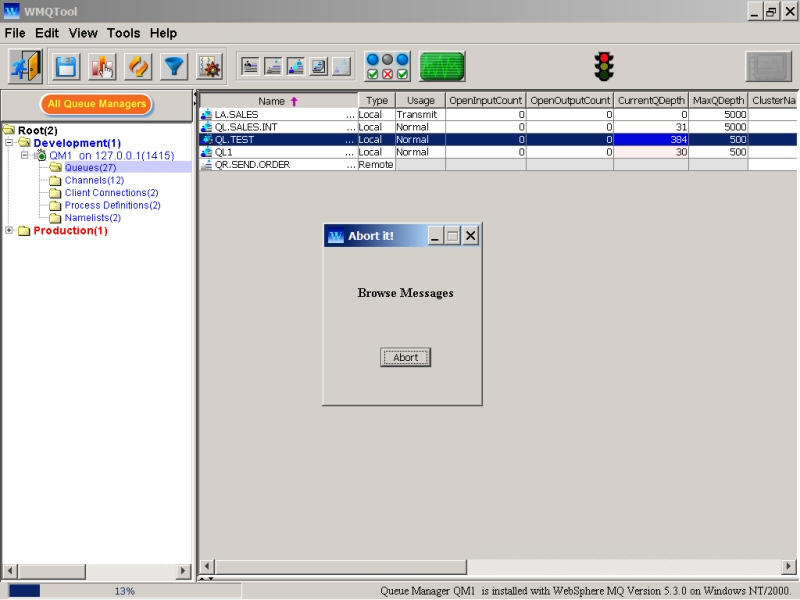
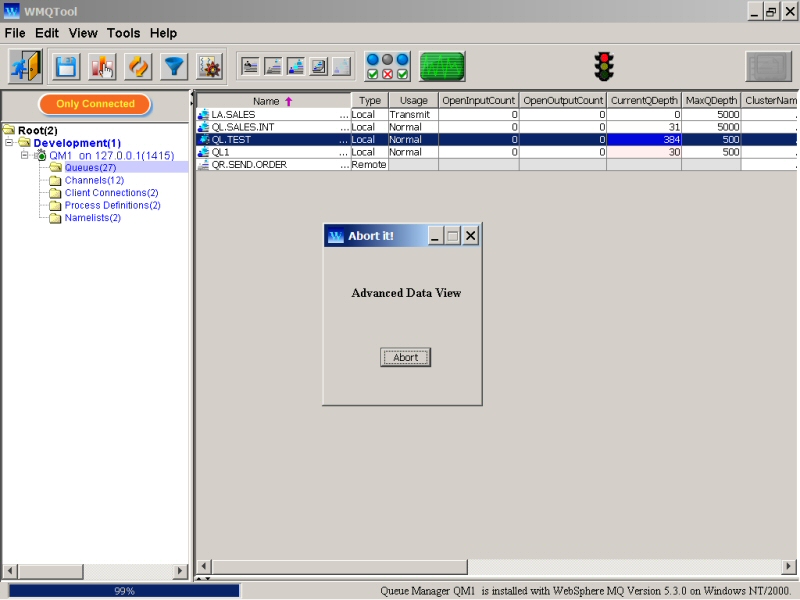
When
the messages are being retrieved from the queue, a progress bar is displayed
at the left bottom corner. The whole screen is freezed and Triffic Signal
light will turn red ![]() to
indicate that WMQTool is waiting for server response OR doing some activities.
to
indicate that WMQTool is waiting for server response OR doing some activities.
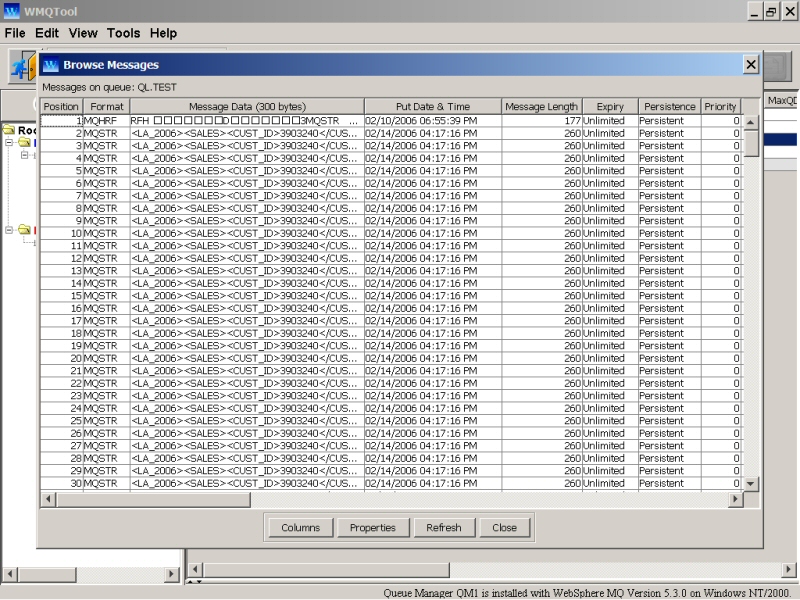
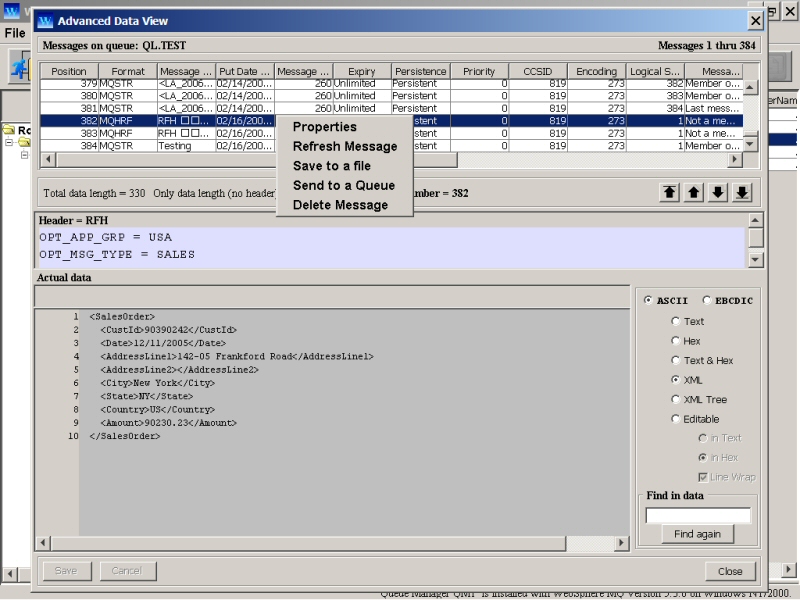
Once you get the desired messages in a separate browse window, you can do any of the following with each of the message.
1. Properties.
2. Refresh Message.
3. Save to a file.
4. Send to a Queue.
5. Delete Message.
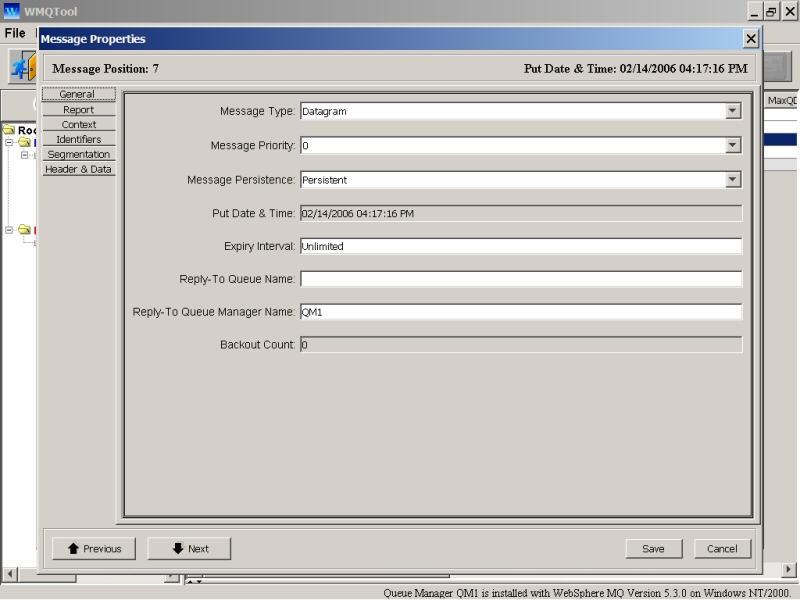
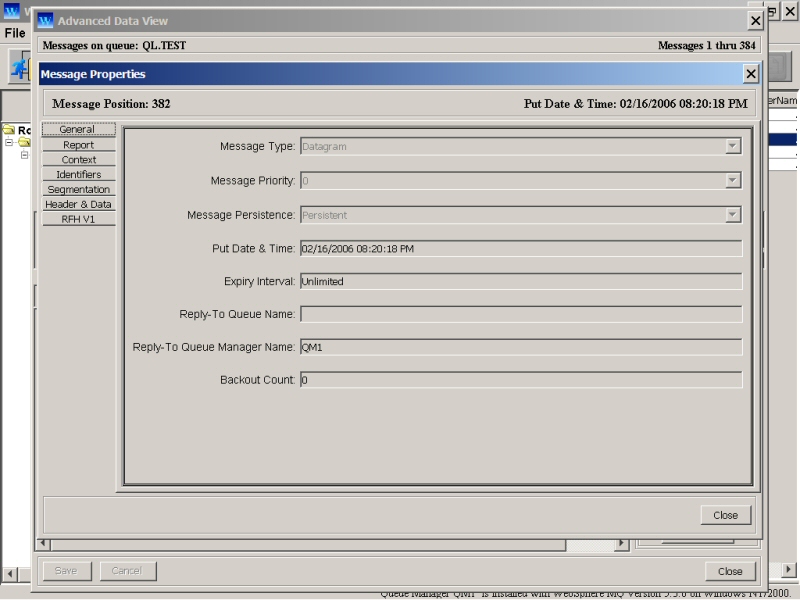
Message Properties:
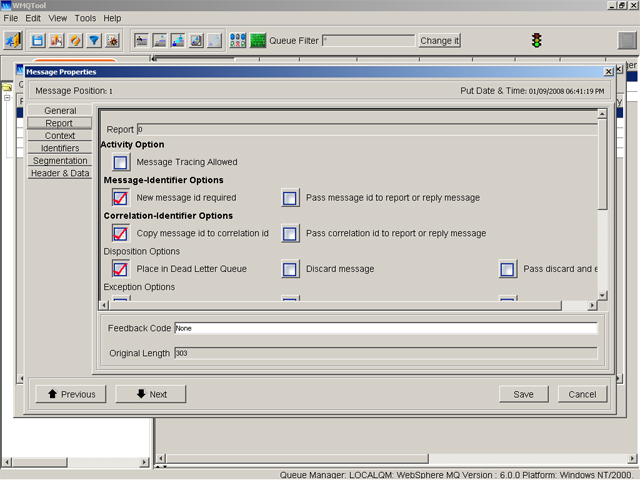
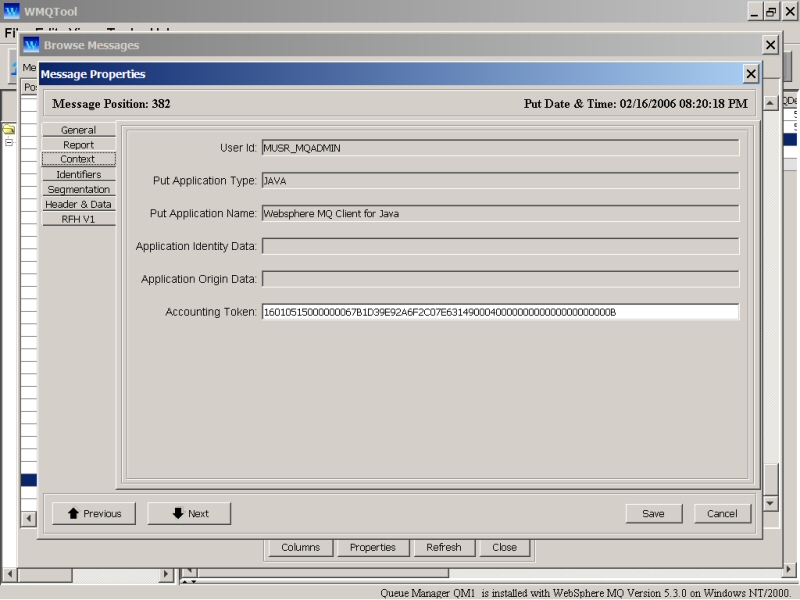
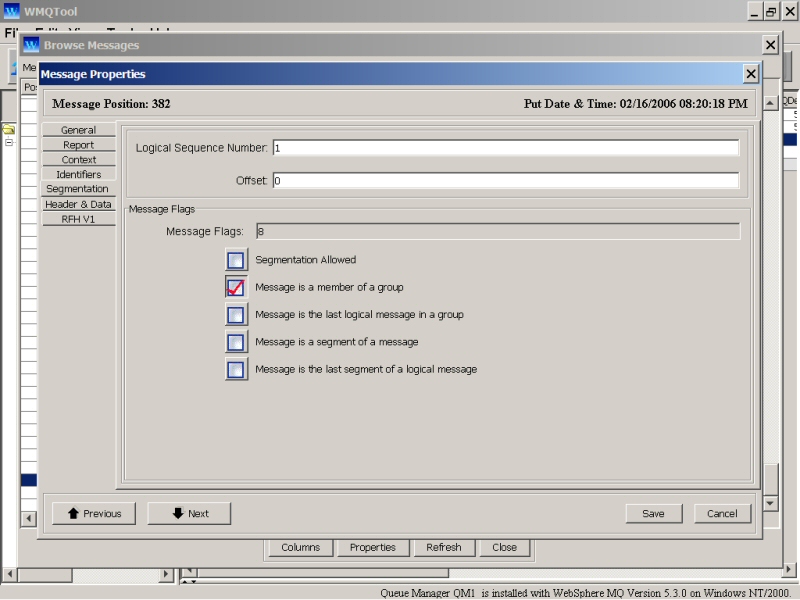
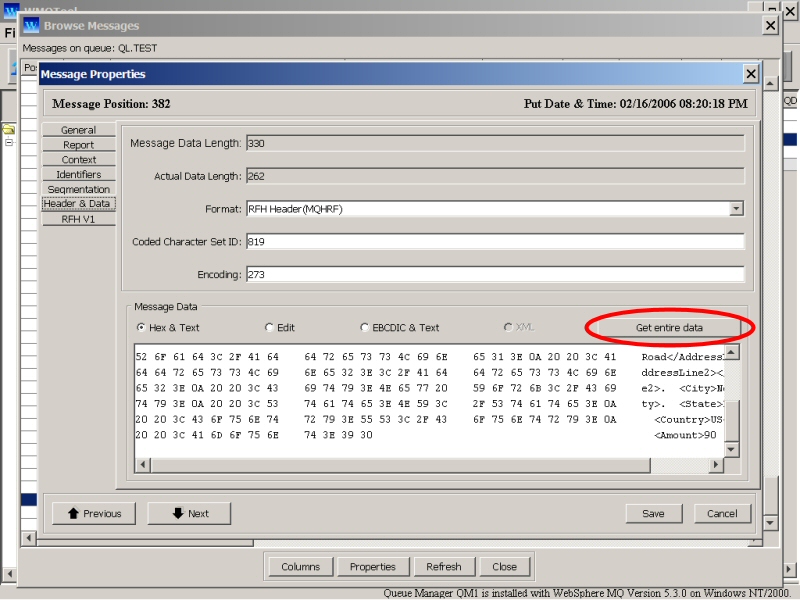
By this option, you can view the properties of a message, view the data and change the data in Text format. There are 6 tab pages namely, General, Report, Context, Identifiers, Segmentation, Header & Data. General tab page provides with general properties, Report with report options, Context with information about the application who has put the message, Identifiers with Message Id and Correlation Id, Segmentation with message flags, Data with actual data contained, RFH V1 with RFH header version 1.0 and RFH V2 with RFH header version 2.0. RFH V1 and RFH V2 will only appear if that header is present in the message.
To enter Report options, click on 'Report' tab. Mark the check boxes for the desired options in Report attribute. The value for Report attribute will be automatically calculated and displayed at the top. The disabled options are not relevant for the current queue manager version.
This way, you can select any tab page and edit message properties displayed on it.
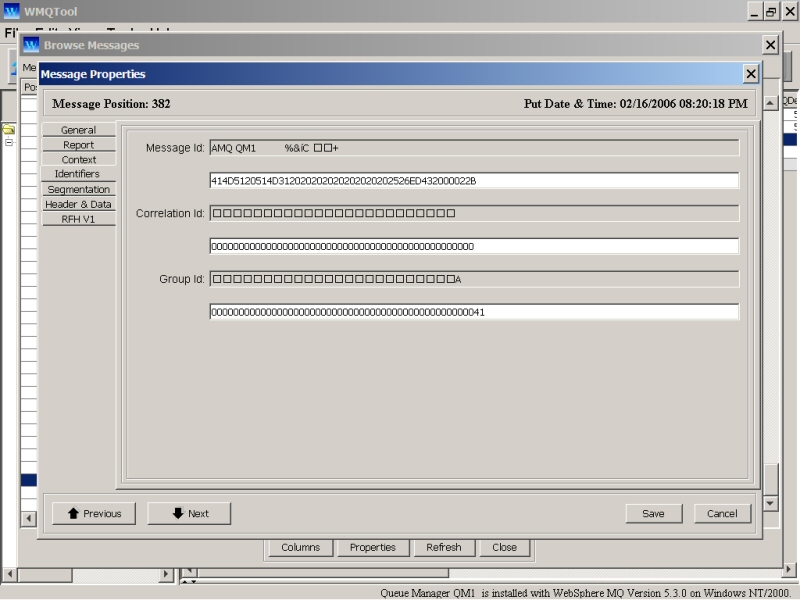
You can change the Message Id, Correlation Id and Group Id of any message by entering hexadecimal values in the text boxes provided for, as above.
Viewing message data:
Suggestion: To view the message data in a better way, instead of viewing it in Browse Messages, select 'Advanced Data View' from the drop down menu by right clicking on the queue..
To view the data here, click on the tab page ‘Header & Data’. The bottom window displays the data. You can view data of any message in 4 different ways by checking any of the four check boxes: Hex & Text, Edit, EBCDIC & Text and XML. You can also view position of message currently being viewed. You may want to view previous or next message by clicking on Previous or Next button.
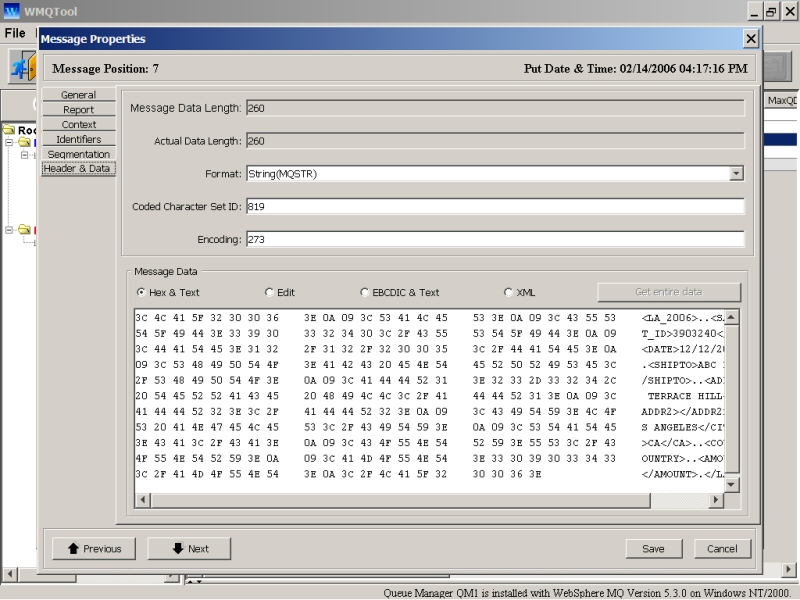
By default, Hexadecimal check box is selected. This view displays 3 clusters of hexadecimal values each of 8 bytes and corresponding characters in text at the right.
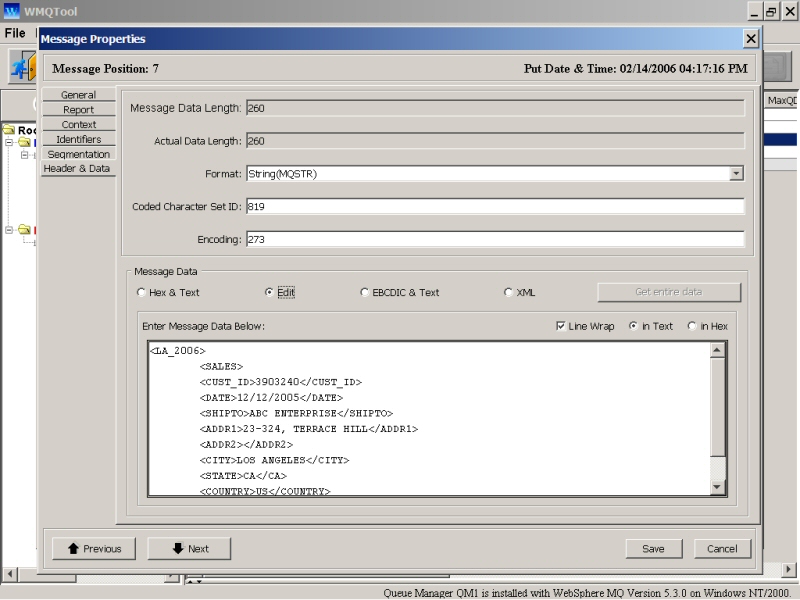
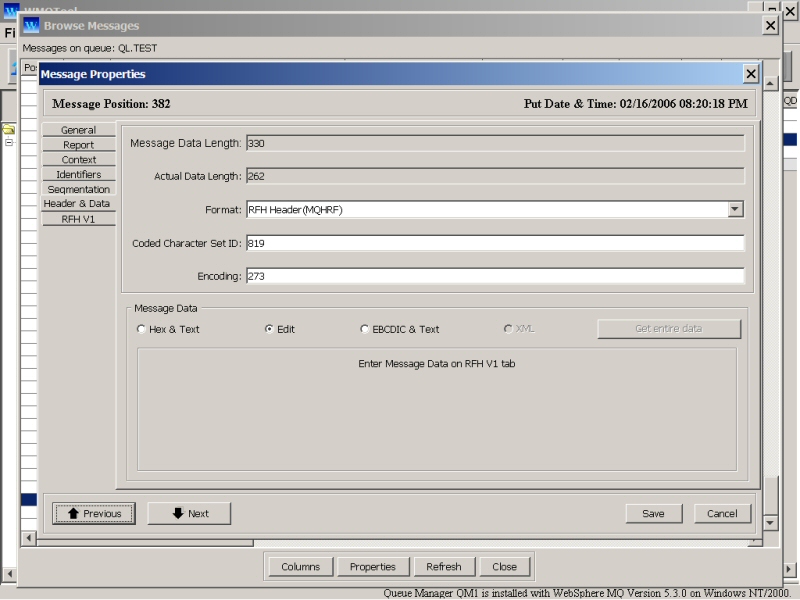
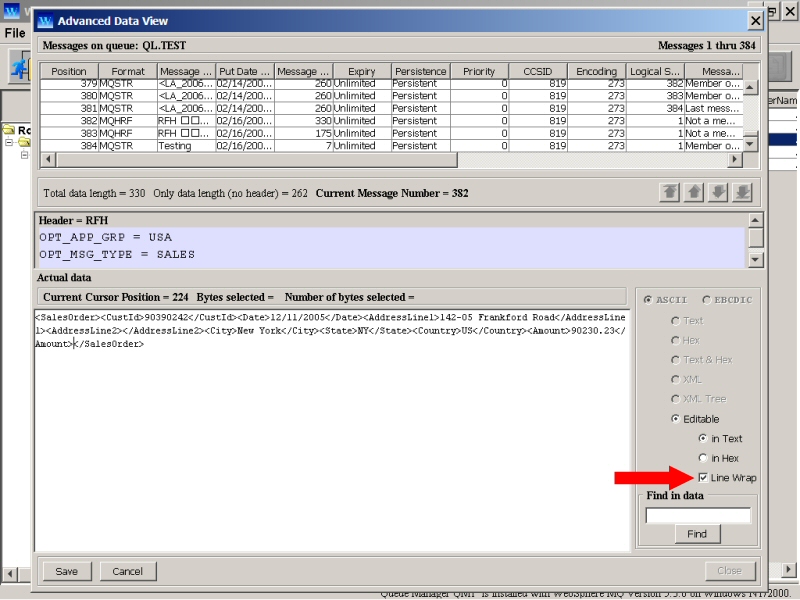
When you check mark 'Edit' radio button, it displays the data in the text format. This data is 'editable' in text and in hex. If the data is in a continuous line without line feed, you can select 'Line Wrap' to view all data. Otherwise, a single horizontal line is displayed which extends the text area and you have to use horizontal scroll bar to view all the data.
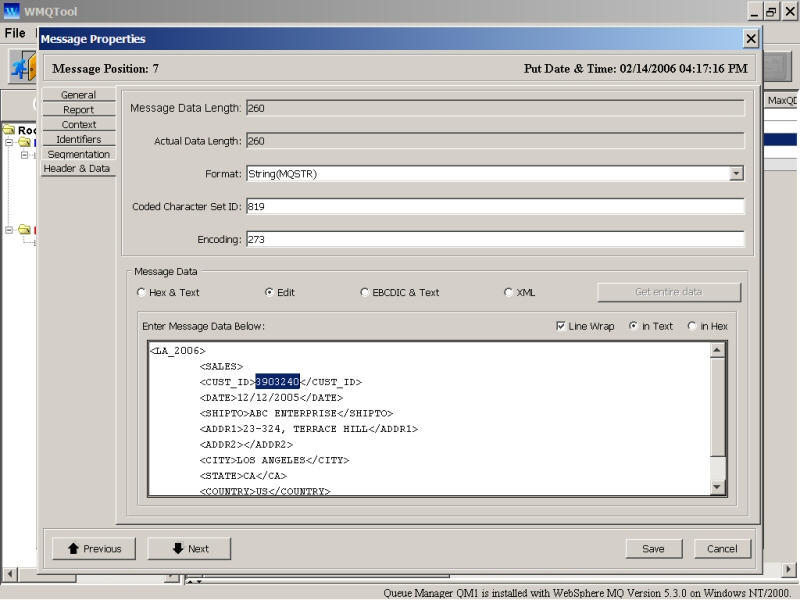
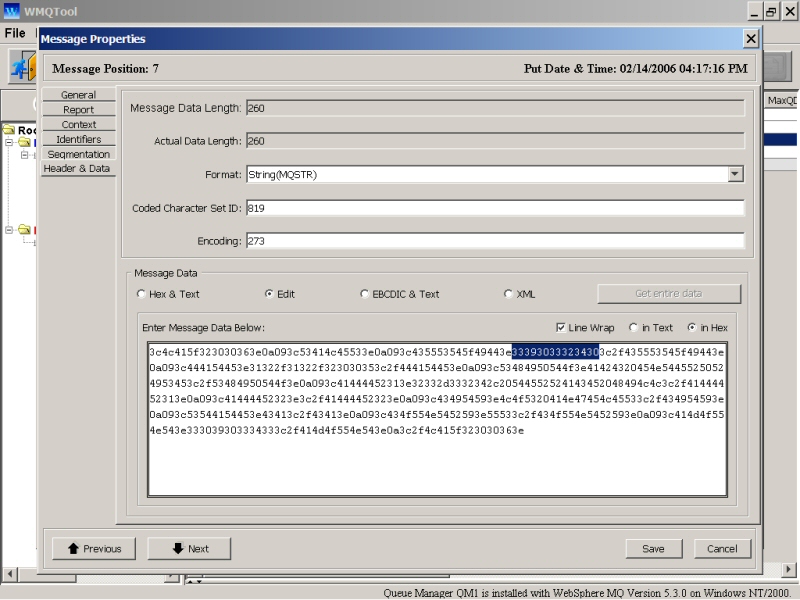
Check mark 'in Hex' radio button to enter/edit data in hexa decimal numbers. To edit some particular bytes, select those characters when they are 'in Text' and then check mark 'in Hex'. Those selected bytes will be still selected in Hex. Edit them and check mark 'in Text' back. Click on 'Save' to save the message or 'cancel' it. Please remember that, after you save your data by clicking on ‘Save’ button, this message now appears as the last message of the queue at this moment.
Initially, it displays only first 300 bytes of the data. But if the message data length is more than 300 bytes, ‘Get entire data’ button is activated. Once you press this button, the complete message data is retrieved.
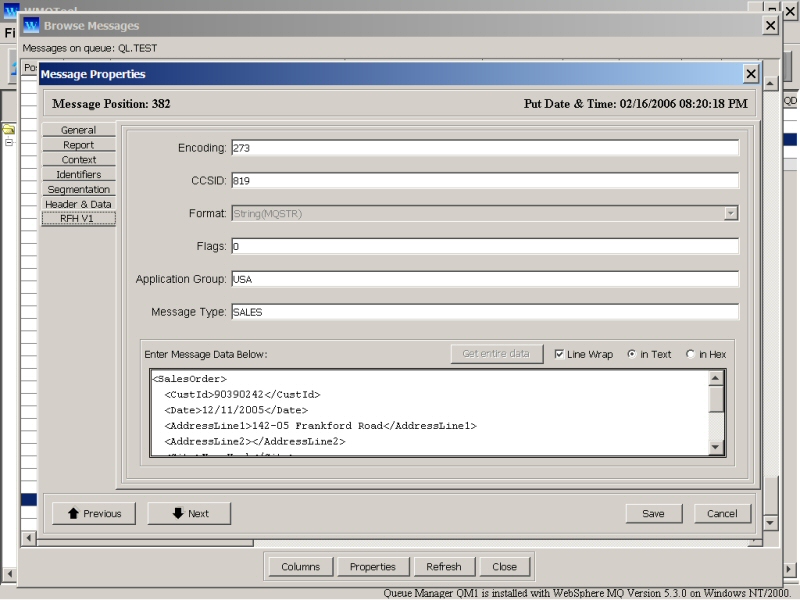
When the message is having RFH or RFH2 header, an extra tab page is added for that header properties. The message data will not be shown under 'Header & Data' page but instead will be shown under that special header. This data is still editable like said earlier.
Refresh Message:
Clicking on ‘Refresh’ will refresh the current message from the latest information from the queue manager.
Save to a file:
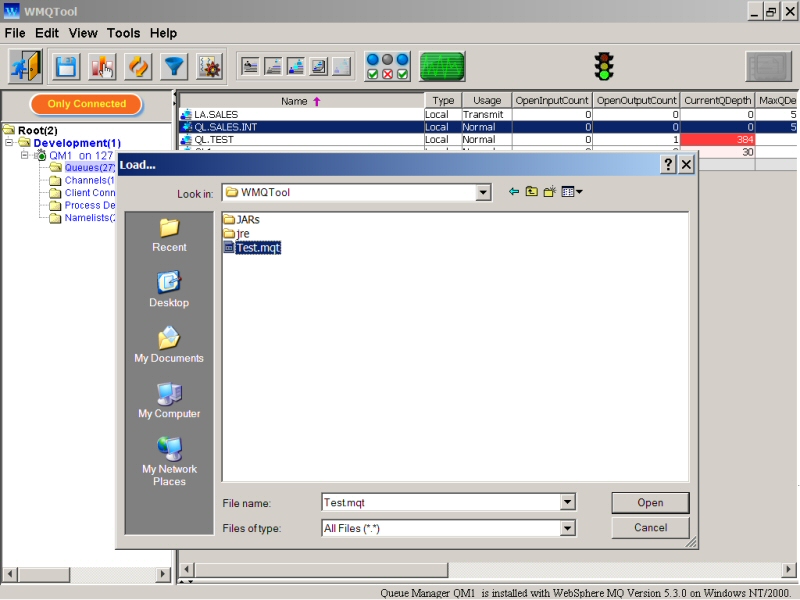
This option lets you save the current message on a file on your disk. It will open up a file name search dialog box.
If the extension is not given, by default, ‘mqt’ is given. The file created will be having a proprietory format to store the message. This file cannot be used with any other tool to load that message except WMQTool.
Click on ‘Save’ to save the message or ‘Cancel’ to cancel.
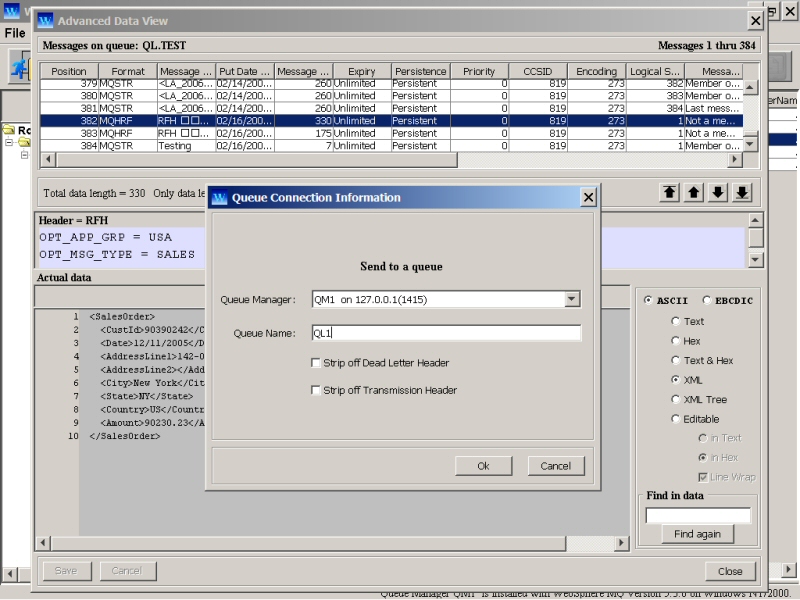
Send to a queue:
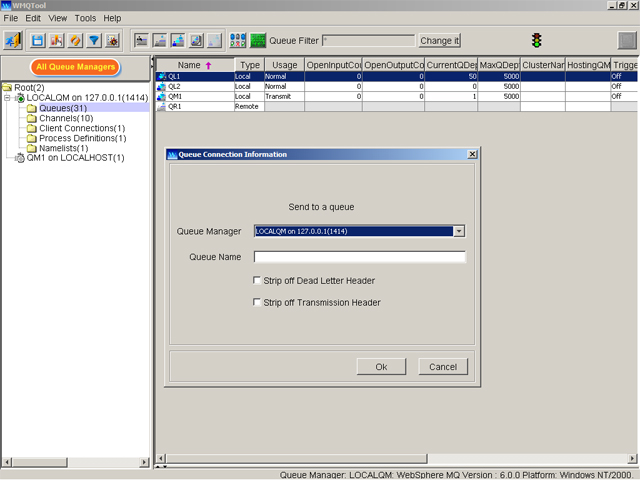
This option lets you send this message to a queue of this queue manager or any other remote queue manager. It will display another window asking about the connection information of the queue and queue manager you want to send the message.
Select the queue manager from the drop down. This drop down includes only queue manager that are already defined in your queue manager tree. If you want to send the message to a queue of queue manager other than that, first you have to define the queue manager on your queue manager tree. Enter the q Queue name. Select ‘Ok’ to send the message or ‘Cancel’ to abort it.
Delete Message:
This option simply deletes/removes the current message from the queue.
In Browse Messages window, you will find 4 buttons at the bottom.
Columns
Properties
Refresh
Close
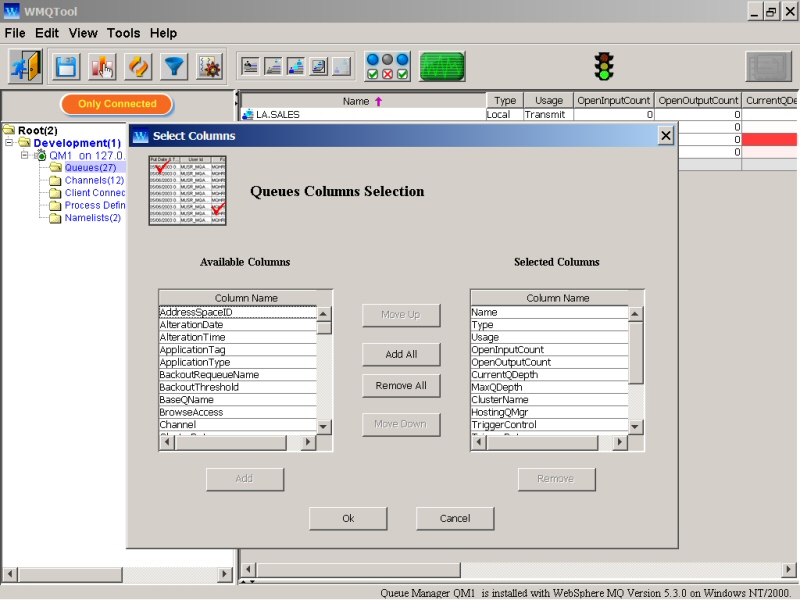
Columns:
This button provides another window to select/deselect columns and order of messages for the Browse Message window and Advanced Data View. The columns are alphabetically displayed on the left Available Columns window. To add any column, select the column by clicking on it on left window of Available Columns. Then click Add button. The selected column will be added to right window of Selected Columns. It will be added just after the currently selected column in the right window of Selected Columns. If no selected in it, it will be just added at the bottom.
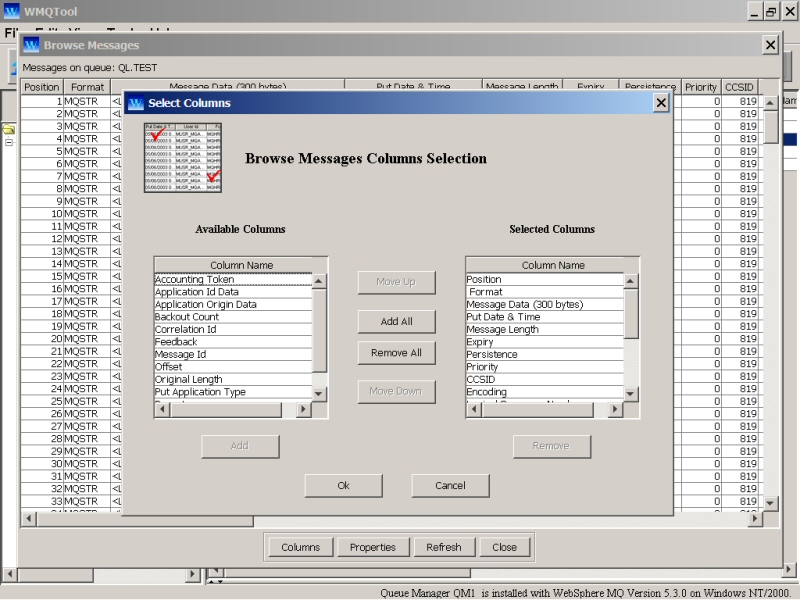
Alternatively, you can also set Browse Messages columns by clicking on 'Select Columns' button on the toolbar at the top and then select 'Browse Messages' as follows.
Properties:
Pressing this button will bring up the window of Properties of the current selected message. It is the same option when you select ‘Properties’ from the popup menu by right clicking on any message.
Refresh:
Pressing this button refreshes the current selected message, just like ‘Refresh Message’ in the popup menu by right clicking on that message.
Close:
Closes the browse messages window.
You can filter messages by setting your own expression involving any of the message properties including message data. You can also combine more than one condition forming a complex expression. It is very useful to extract desired messages from a bunch of messages.
Click here to know more about Filtering Messages feature.
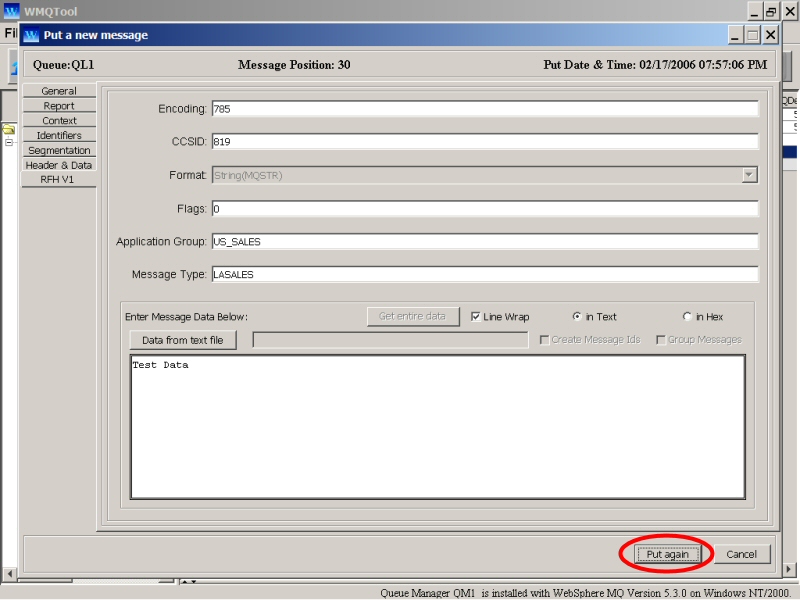
You may want to put a test message on any queue. You can set properties of MQMD for the message to be put. Then you can enter the data in the 'Message Data' window. You can enter just a single message by clicking on 'Put Single Message' or number of messages stored in a file in text form.
To put a message, right click on the desired queue and select ‘Put message’. A new window will open up with default properties of a message.
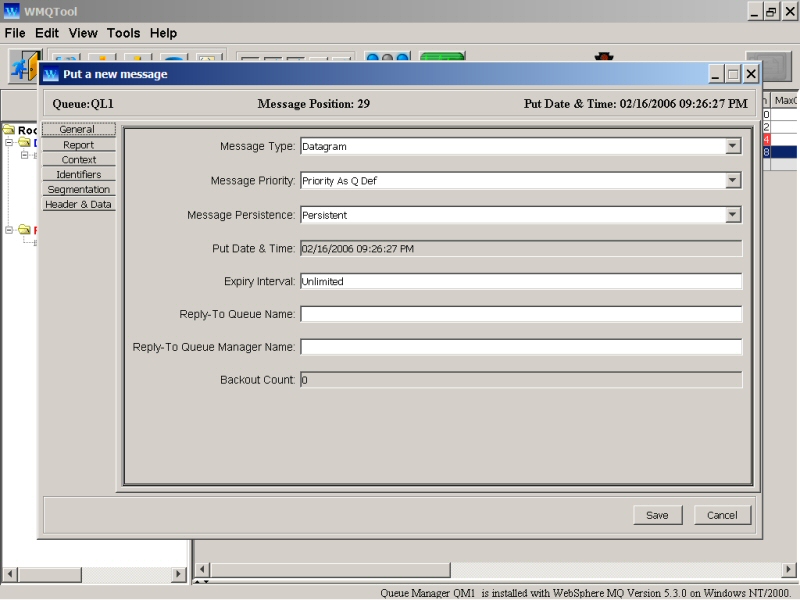
It shows the position of this message going to be in the queue at this moment. It shows you all the writable properties of a message in various tab pages, as discussed earlier.
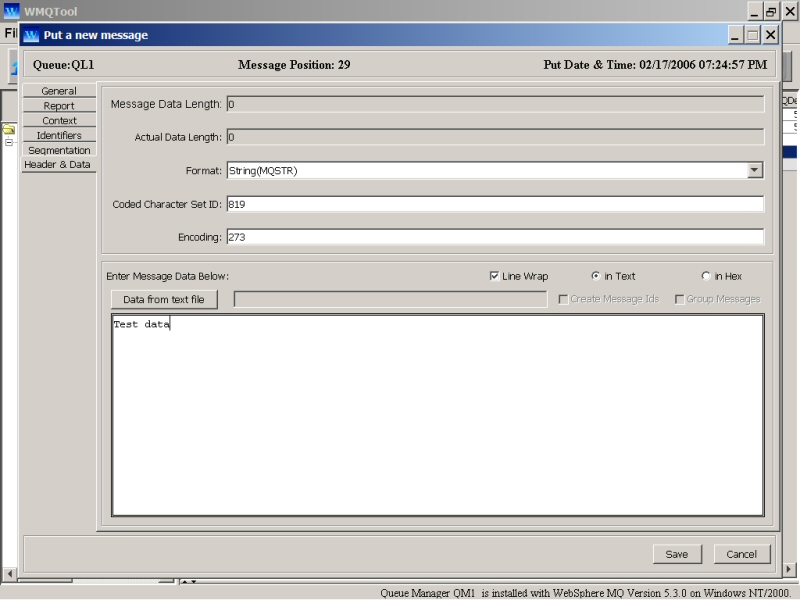
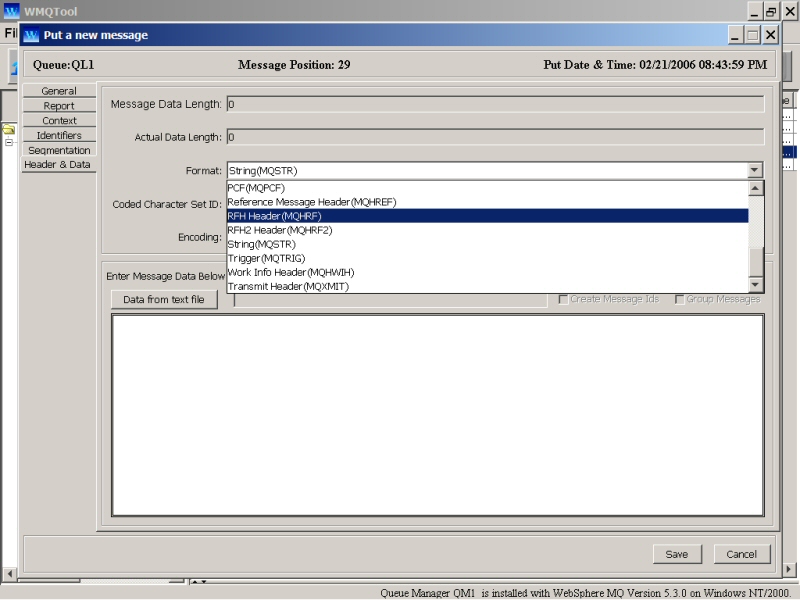
By default, it is of ‘MQSTR’ type. But if you want to add RFH (select MQHRF) or RFH2 (select MQHRF2) header, you may select it and a new tab page will be added into the window accordingly.
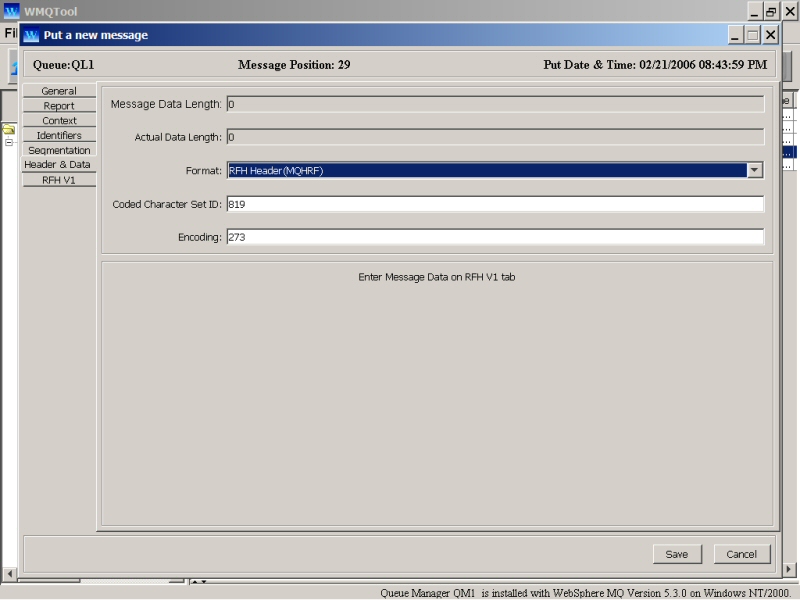
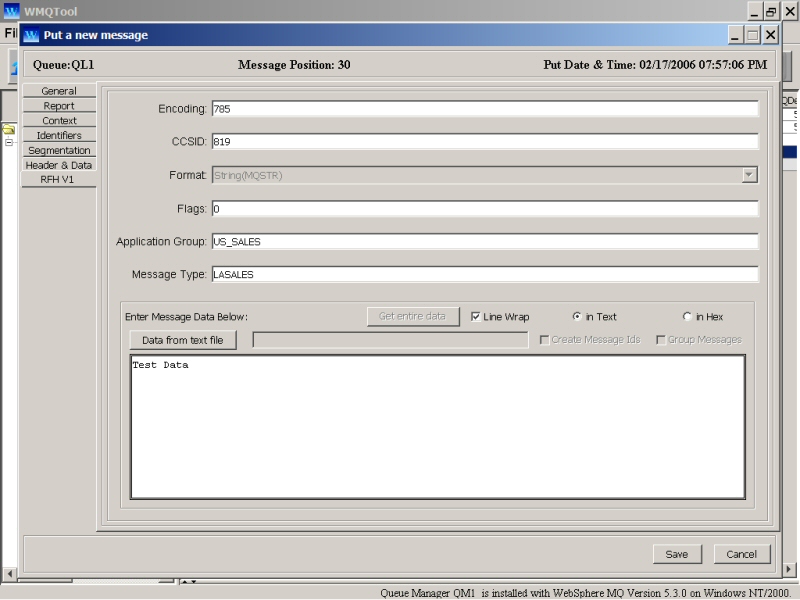
Click on 'RFH V1' tab to enter RFH header properties and message data.
If you want to put messages from a text file, click on 'Data from text file' button. You will be asked to select the text file on your drive. Now when you click on 'Save' button, all the messages stored in that text file will be considered as data portion of the messages and the properties you set on these tab pages will be considered as header for them and then will be put on the queue. Therefore, these messages will have same MQMD structure with same message id. To create all the messages with different message ids, check mark the check box 'Create Message Ids'. To create all the messages in a group, check mark the check box 'Group Messages'. These check boxes are not activated until you select a file by clicking on the button 'Data from text file'. If you have added RFH or RFH2 header, all the messages will have same header after MQMD. The text file is expected to be created by 'Write Messages to a File' option on the same menu and then selecting 'Plain text data'. You may also create your own text file to put messages. But you have to keep in mind certain points mentioned in 'Write Messages to a File' section.
'Put message' window is an independent thread. In other words, you do not need to close this window once you put a message on the queue. For testing purposes, if you require to put same message on a queue again and again, you can keep this window open and still you can work on other functionalities of the tool. Once you put a message, the 'Save' button changes to 'Put again' as follows.
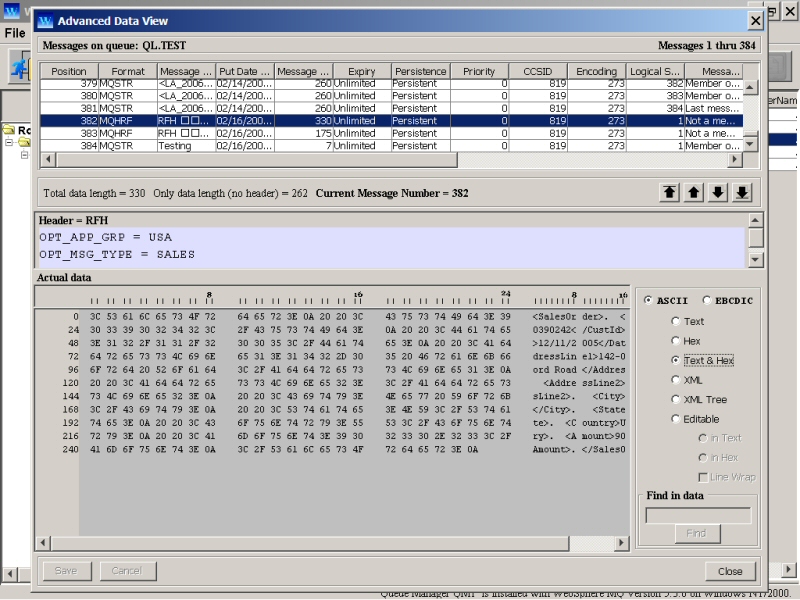
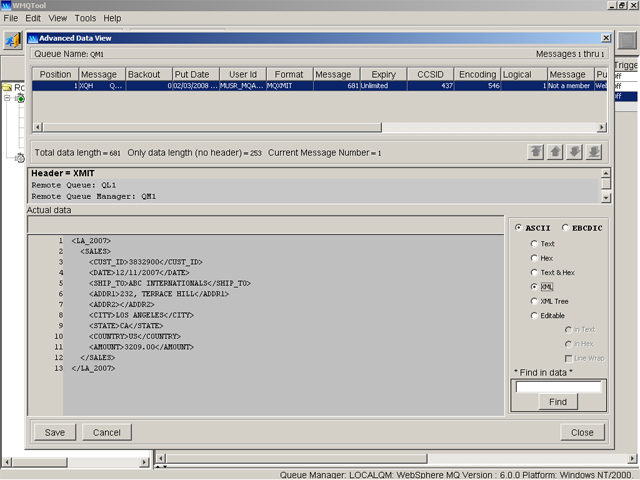
This is a very powerful feature of WMQTool. This allows you to study any message data byte to byte. It is very helpful while dealing with messages for WebSphere MQ Integrator. You may have to check byte to byte of a message data for MRM format (fixed format) while debugging.
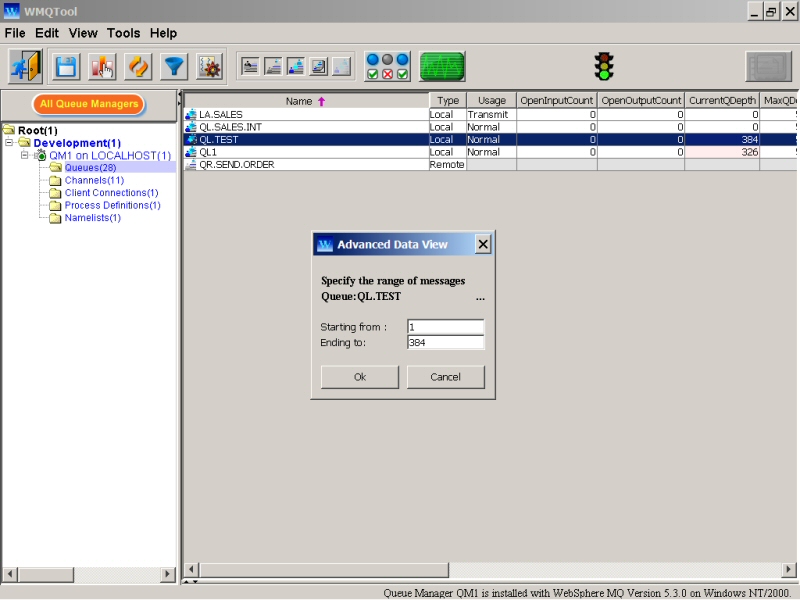
Enter the range of the messages you want to view and click on 'Ok' button.
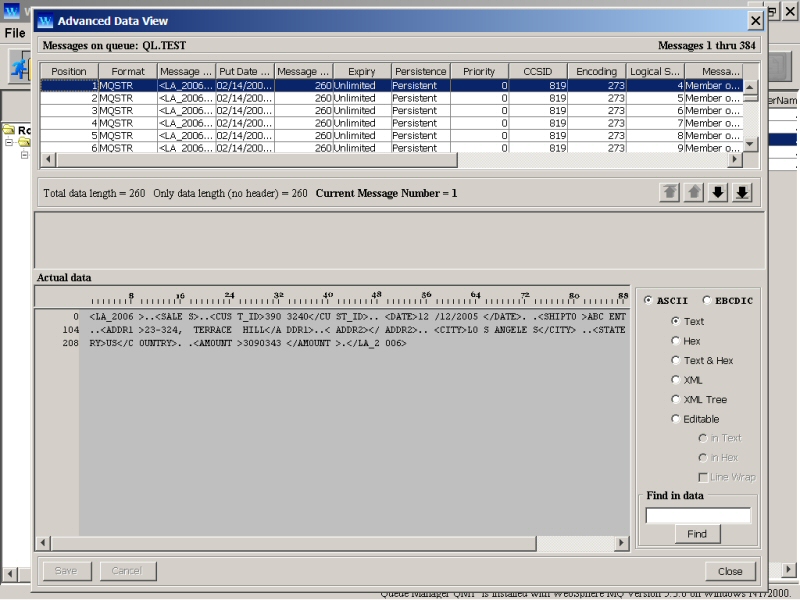
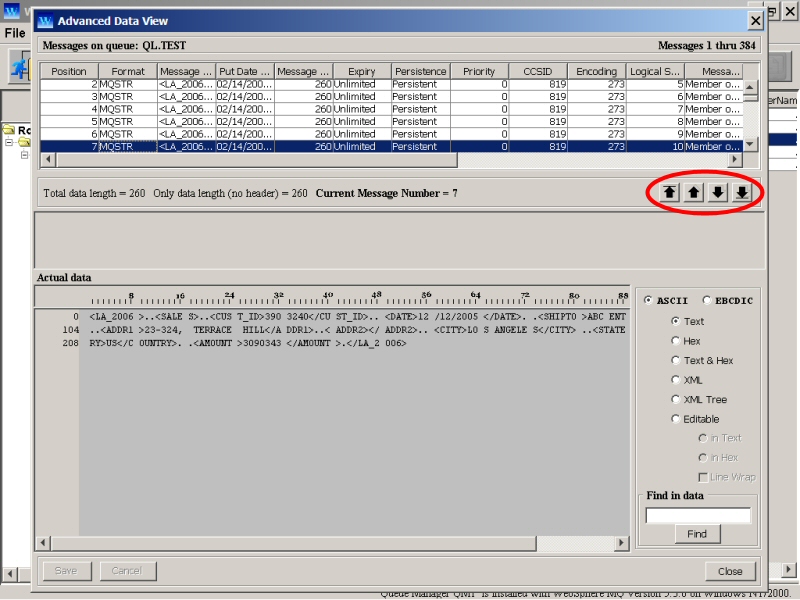
On the left in top row, you can see the name of the queue on which these messages are stored. On the right in top row, you can see messages from and to you can view. Below this, there is a browsing window of 8 rows. This displays the 8 messages from all the messages. You may select First, Previous, Next or Last message by clicking on 4 arrow buttons provided on right side. To select a message randomly, you may select it by clicking on that message in browse window. You may want to scroll all the messages by using vertical scroll bar on the browse window. Whatever way you select, the selected message’s information is displayed beneath the browse window.
Just below the browse window, you can view ‘Total data length’ of the current message. You can also know ‘Only data length (no header)’ which indicates message data length without including any type of header. The ‘Current Message Number’ indicates position of the current message in the queue currently. On right, there are four arrow buttons meant for selecting message.
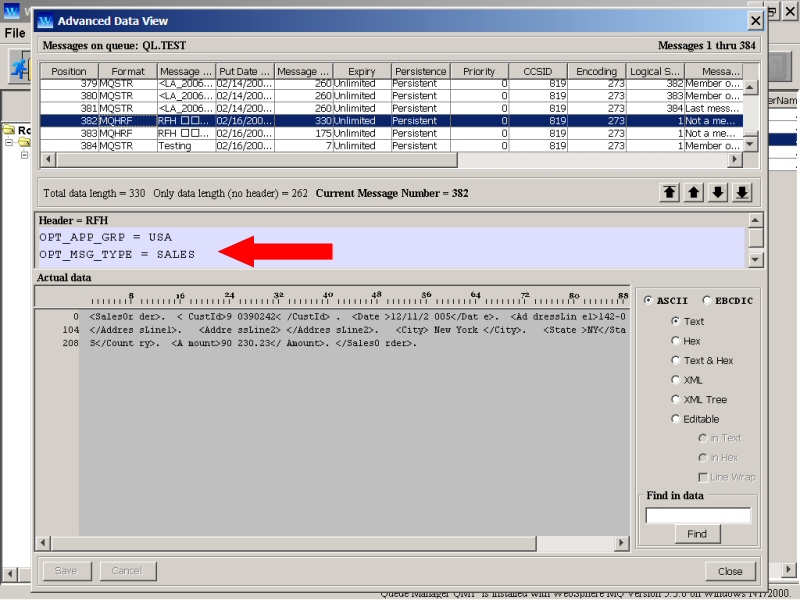
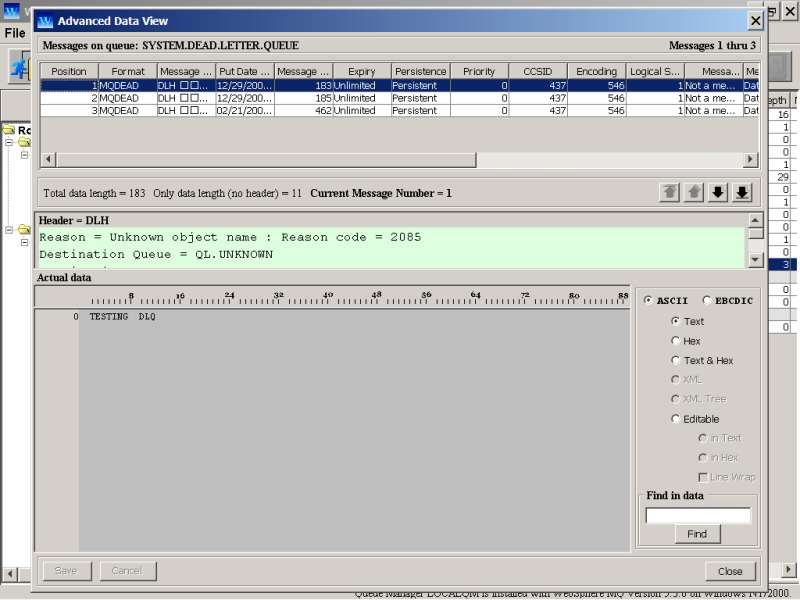
Below this, there is information about type of headers like RFH, RFH2 and DLH. The other values about that header are also displayed below the Header type. You may use right hand side scroll bar to view all of them if they are hidden.
Then comes the actual data area. This data can be viewed as Text, Hex, Text & Hex, XML, XML Tree and Editable. You can view in ASCII as well as EBCDIC format. All these data are provided with appropriate rulers on top of data area to find a particular column and on left side to find a particular row. This helps to exactly locate a particular byte or bytes.
Text:
Text view allows you to view all the bytes in ASCII or EBCDIC characters. Non-printable characters are converted into dots. You can exactly verify the number of characters with the data length. There can be 104 characters in each line. The number on the scale on left side indicates number of characters up to the end of previous line. You can find a particular of portion of data by entering in 'Find in data' and then clicking on 'Find' button.
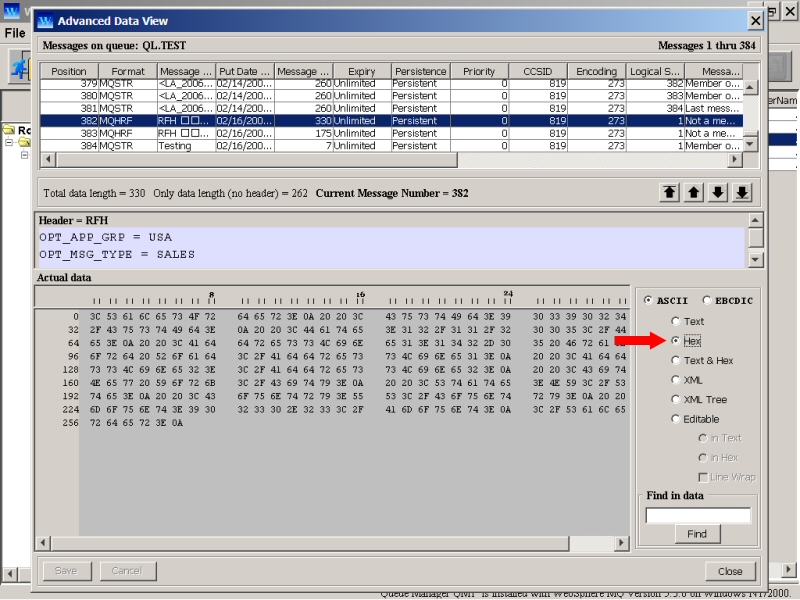
Hex:
Hex view shows you all the bytes in Hexadecimal values. There will 4 blocks of 8 hex values each in one row making a total of 32 bytes per row. To find a series of Hex bytes, enter the bytes values in 'Find in data' section. For example, you may enter like '32 3C 2F 49 6E'.
Text & Hex:
This is a combination of Text and Hexadecimal views. You can view 24 bytes of data in Hexadecimal and ASCII characters format in each row. 'Find in data' is not provided for this option. So it is deactivated.
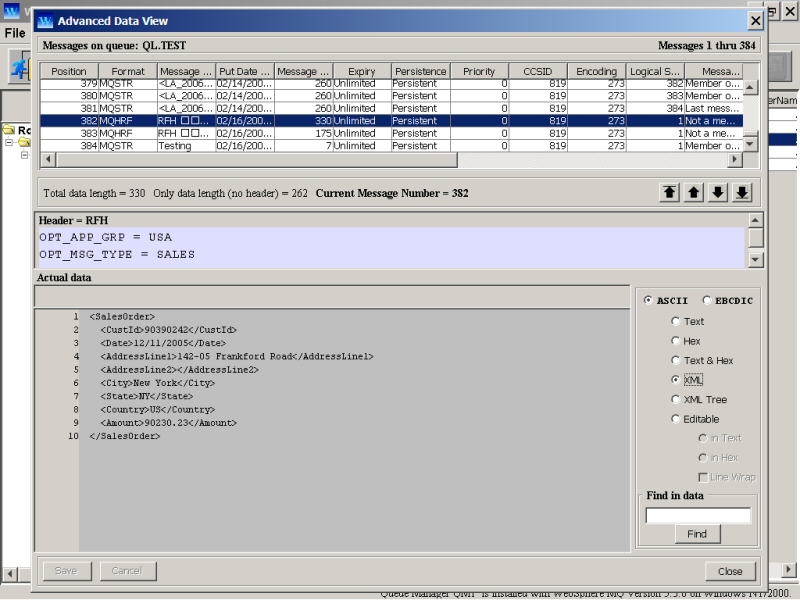
XML:
If the data is a valid XML document, then this check box is enabled, otherwise it is disabled. You can see a well formatted XML document. The scale on left side displays line numbers. There is no ruler displayed at the top of data area.
XML Tree:
If the data is a valid XML document, then this check box is enabled, otherwise it is disabled. You can see a tree type hierarchical structure of XML document. You can see all the tags with their values in hierarchical form. No scale or ruler are displayed. By viewing data in this mode, you can make sure that XML is a valid document and parsed successfully by the parser.
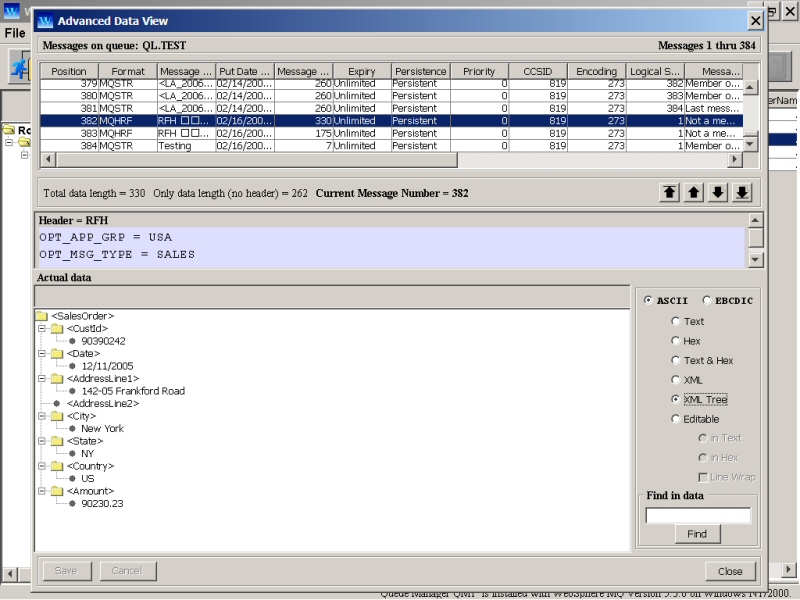
This option is a good tool to verify the data to be a valid XML document. If it is an invalid XML, it will give a parsing error.
Editable:
You can select or edit the data. To help you to select/edit any particular bytes of data, Current Cursor Position, Bytes Selected and Number of Selected Bytes are displayed. All the data area displayed in readable form. If the data are not in readable form, it is converted before displaying it. You may want to select appropriate option ASCII or EBCDIC whatever case may be, before selecting 'Editable'.
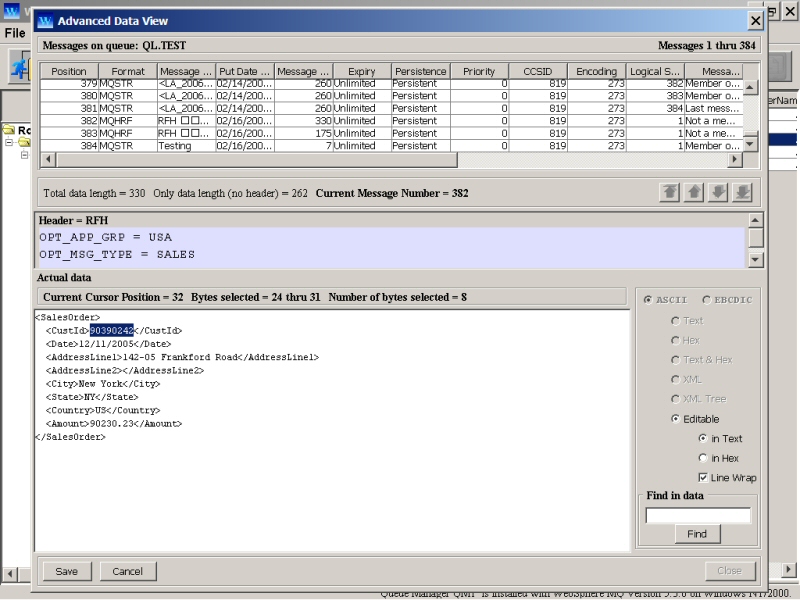
When you select Editable view, all other buttons are disabled except ‘Save’ and ‘Cancel’ on the left bottom corner. This is because, user is forced to either save the changes or cancel, before doing anything else.
When you use arrow buttons to select first, previous, next or last message, the selection of the check box on data area does not change. So if you have selected ‘Editable’ and then after clicking on ‘Save’ or ‘Cancel’ button if you select another message, that message is automatically displayed in ‘Editable’ view.
This option allows you to select the message data in its original form. You may want to cut and paste it anywhere else.
If the data is a continuous series of bytes without a line feed, it will be displayed with words wrapped if the check box 'Line Wrap' is checked. If not checked, you will have to use horizontal scroll bar to view the whole data.
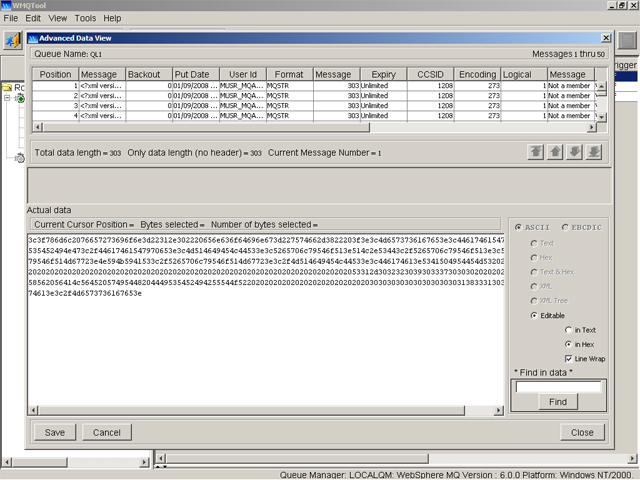
You may want to edit the bytes of data in hexa decimal values. Check mark the radio button to 'in Hex' and all the data will be displayed as a series of hex numbers. You may want to enter/edit hex numbers. Once done, check mark the radio button 'in Text' to convert it back into text.
Finding desired string/numbers in data
Enter a string or number to be located in the data in "Find in data" field and click on "Find" button. WMQTool will show you the entered string highlighted in the data, if it is found. The "Find" button changes to "Find again".
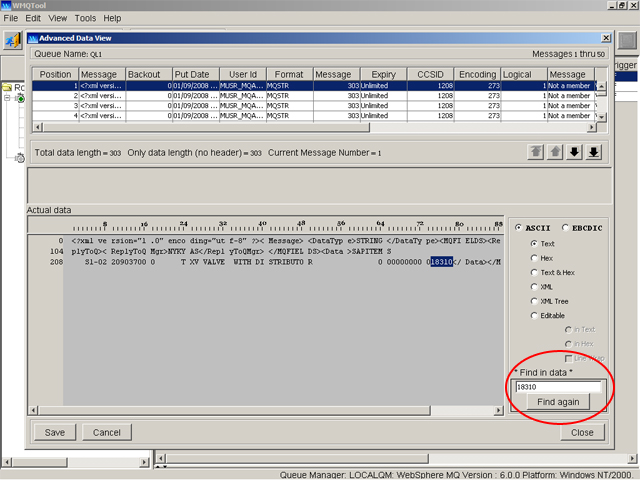
To search for bytes in hex, select the radio button for Hex. Then enter a series of hex numbers separated by a space and then click on "Find" button.
Note that "Find in data" is not available when you select 'Text & Hex' due to layout of the data in the window.
You may want to see MQMD fields (message properties) of a message, refresh message, save a particular message to a file, send a message to a queue or delete a message. You can do all these functions from Advanced Data View as well.
Look at the message property like below.
...and Send the message to a queue!
WMQTool lets you view a message with Dead Letter Header and Transmission Header with all headers and data separately. This helps you finding more information about the messages sitting on Dead Letter queue or Transmission queue. It provides you information about Destination Queue, Destination Queue Manager, RFH header if any, and the actual data.
Use ‘Close’ button at the right bottom corner to close this window when you are done.
Many times, you need to check properties of a queue very frequently. For example, if you are waiting for a queue to become empty when an application is consuming the messages stored on a local queue, you might want to refresh the queue property 'QueueDepth', frequently. Selecting 'Auto Refresh' on this queue will serve this purpose.
Right click on the local queue you want to set for auto refresh, and select 'Auto Refresh'. It asks you at how many seconds you want to refresh. The default and minimum is 5 seconds. Enter any number greater or equals to 5 and hit 'Ok'.
A new window with only entry of that queue is displayed. This queue entry is refreshed at specified seconds.
As you can see, the traffic signal is showing 'green' light. It means that you can work on the base window of WMQTool keeping Auto Refresh window aside.
If you select another queue with the same interval of seconds, it will be added in the same window. But if you set different time interval, a new window will be opened.
Clicking on 'Close' button will close the window.
Using this option, you can set Triggering of any Local queue ON or OFF.
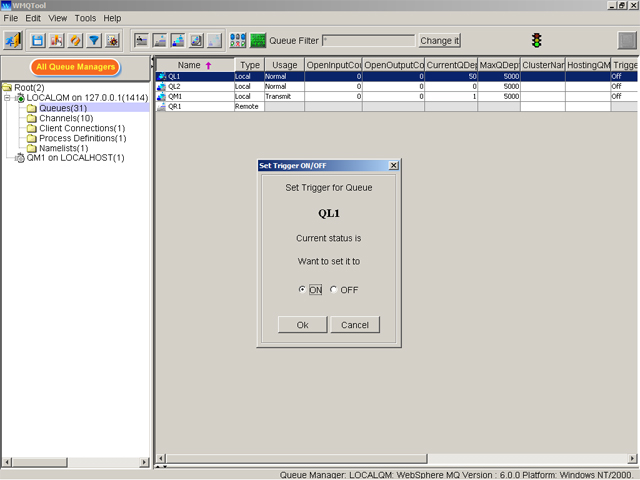
Alternatively, you can set this by selecting Queue's Properties. But this option makes it easier for user to change the status of Triggering on local queue. Moreover, if you want to authorize a user to change the Trigger setting ON and OFF but do not want him to change other queue properties, you can selectively authorize him for this option and forbid for 'Change Queue Properties' in Authorities Settings. Please refer to 'Setting Authorities' for more information about how to set different authorities.
When you want to take a backup of messages of a queue, you can select this option. It will ask you the name of the file where you want to store all the messages.
These messages can be written in two ways.
One, 'As It Is', means they will be written with all the properties of MQMD, headers and data as they are into a file. The file is having ‘mqt’ as default extension. This file cannot be read by any other tool. WMQTool writes these messages in its proprietory format. This file may not be possible to be read by any other tool.

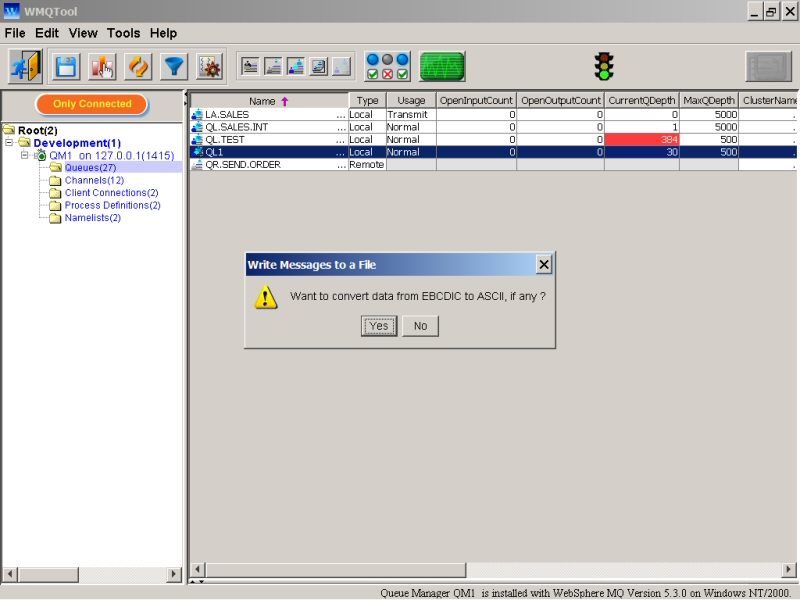
The other way is, 'Plain Text Data'. When you select this option, WMQTool writes ONLY DATA portion of the message into a file in ASCII text form. The first line of this file consists of a number, indicating how many messages are there in the file. This number is used only to calculate the correct position of the progress bar while putting these messages back on a queue. If it does not match with the number of messages in the file or if it is missing, WMQTool will NOT fail to put messages on the queue. WMQTool puts its own tags in the beginning and end of a message to enable to identify start and end of a message. The tag '<WMQTool>' in the beginning and '</WMQTool>' at the end. If you do not want these tags in the text data in the file, WMQTool has no option provided but you can easily remove them by using any text editor or text processing program. Replace those tags for none and they will be removed. You can create a text file with a view to putting the messages on a queue by keeping in mind the points mentioned above.
To put these text messages on a queue, select 'Put Message' option on the same drop down menu. Refer to 'Put Message' above for more information.
WMQTool asks you if you want to convert the data from EBCDIC to ASCII before putting into the text file, if any. Respond to 'Yes' if you want to convert.
Click ‘Save’ to save the messages or ‘Cancel’ to abort it.
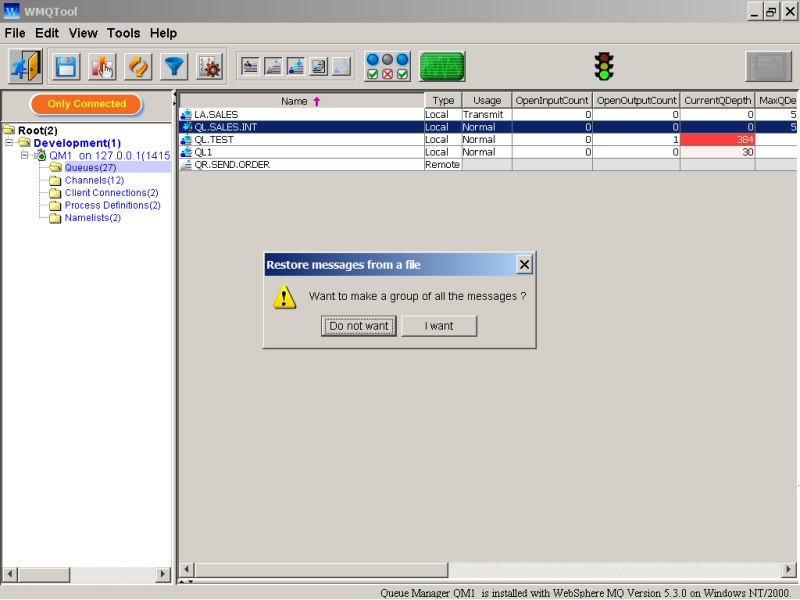
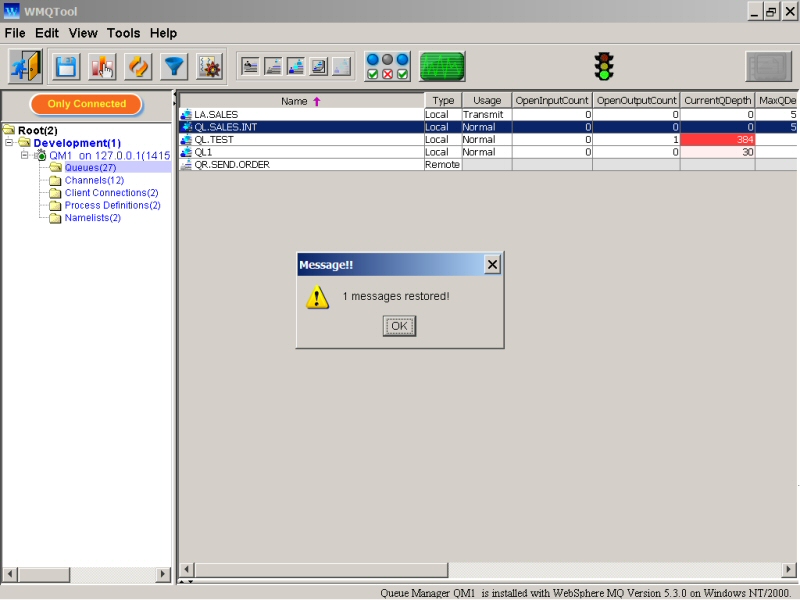
You can restore messages to any queue from any backed-up file created by WMQTool.
After you select the file to restore messages, WMQTool asks you if you want to make a group of all the messages. This means, if you respond to 'Yes', WMQTool will put all the messages in a group.
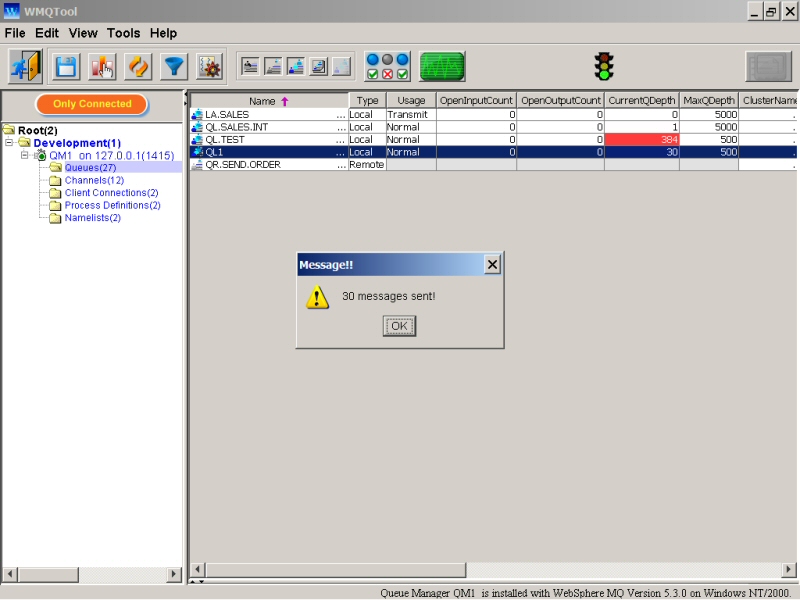
You may want to send messages from one queue to another. This option lets you send all the messages from one queue to another. This queue may be of same local queue manager or may be of a remote queue manager. After successful send to another queue, it does not remove messages from the original queue. If you want to remove these messages after send, you may either use ‘Clear Queue’ or ‘Delete Messages’ option.
You may optionally select check box to strip off Dead Letter Header on a Dead Letter Header queue or Transmission Header on a Transmission queue from the messages before they are put on destination queue.
This option removes all the messages from a local queue, ONLY if no other application has opened this queue for input/output purposes. In other words, if Open Input Count and Open Output Count for the queue are zero, then and then it will be successful. If it is successful, it can remove any number of messages from the queue in a fraction of a second.
![]()
But if the queue is opened by any application for Input or Output purpose, it will display messages as following screens.
![]()
![]()
![]()
This means that you can still delete the messages thru 'Delete Messages' option. But they are deleted one by one.
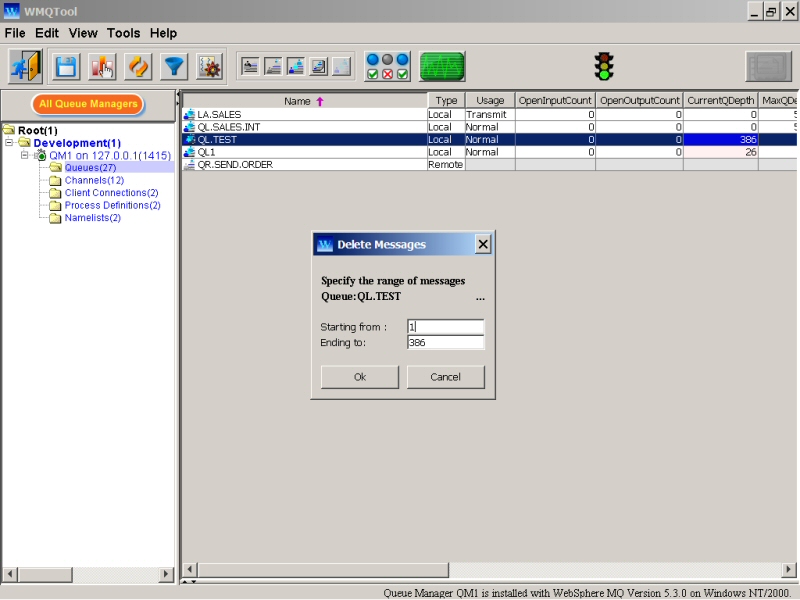
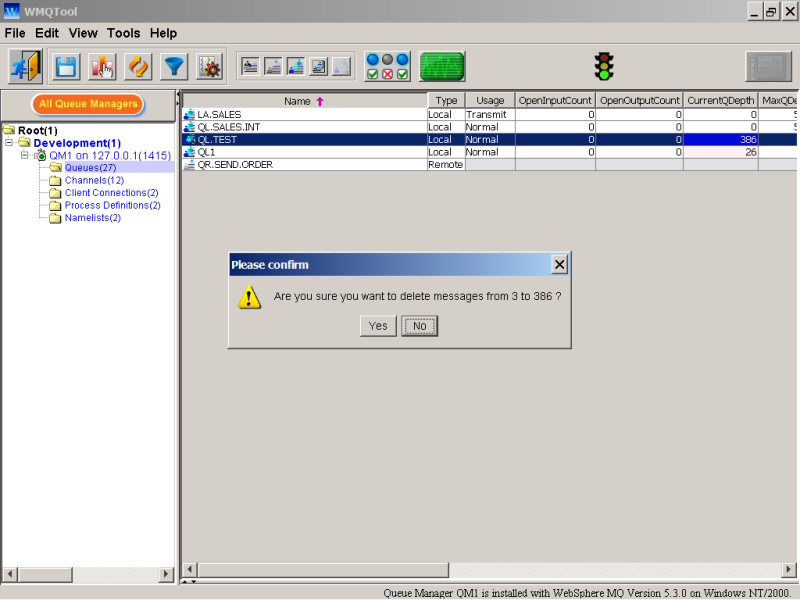
This option lets delete all or particular range of messages. It fails if during the process of entering this range, some other user deletes any message on that queue. This is because, the range is provided upon physical position of all the messages and removing messages from queue will change the physical position of all the subsequent messages. So WMQTool cannot decide which messages to be deleted. Hence it fails.
This option deletes all messages one by one. So it will take time depending upon the number of messages to be deleted unlike Clear Queue option. You can specify the range of the messages to be deleted.
In Queue view, the selected queue properties are displayed in tabular form in the right window. The selected columns in this view can be changed by clicking on columns button in the tool bar. For information about how to select the columns, please refer to 'Columns Selection'.
In WMQTool 3.0, CurrentQDepth property is displayed with proportionate red color as background to indicate how much percentage the queue is filled with messages. To calculate the percentage, CurrentQDepth and MaxQDepth are considered. The background of the cell in the view turns red as the queue gets filled. For 100% full queue, a complete dark red colored background is set and for 0% depth, white colored background is set. This is to help the user visually observe the queue depth.
In queue status, you can see certain fields which provide you with information about applications connected to the queue. The number of applications connected are also indicated by OpenOutputCount and OpenInputCount properties. Some of the functions on queue prohibited by queue manager if, OpenInputCount or OpenOutputCount are greater than zero. For example, queue manager will not trigger if OpenInputCount is more than zero. In this situation, you may want to know which connection is having input handle on the queue. By looking at the information provided in InputApplications column, you can easily find out which application is holding this queue. You can also find its Process Id and who is the executer of the application. You may pursue with that user to stop this application. If this is not possible for any reason, you may want to kill that process on server by using that Process Id in Task Manager, if the server is on Windows.
To view properties of a particular queue only, select the 'Properties' from the drop down menu.
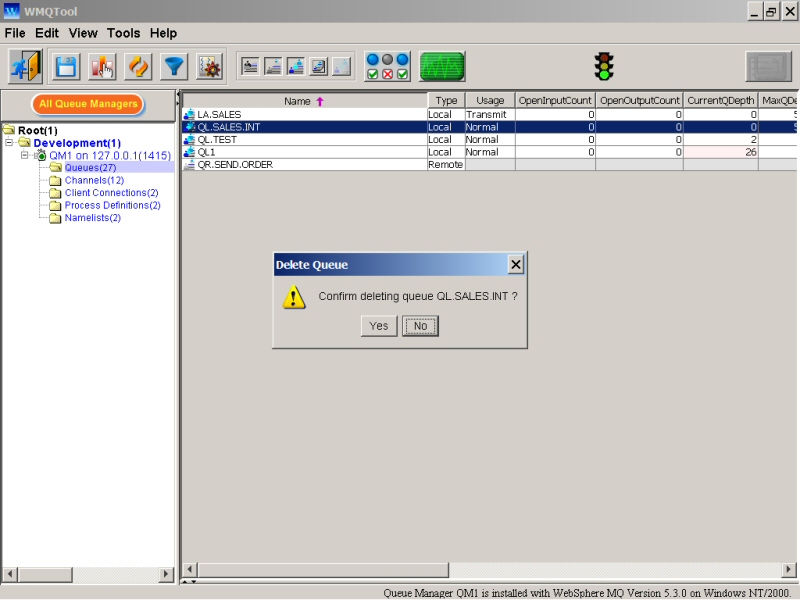
This option lets you delete the queue. In case of Local queues, if there is any message, means the CurrentQDepth is greater than zero, it will ask you one more time to confirm the delete.
If there are any messages on the queue, it one more time confirms it.
This option refreshes only currently selected queue. It will reflect latest changes made in that queue may be by the same user or the other.