
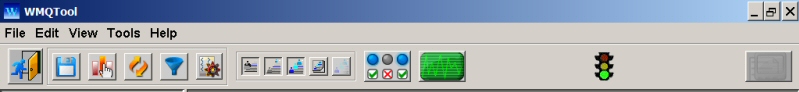
Tool bar:
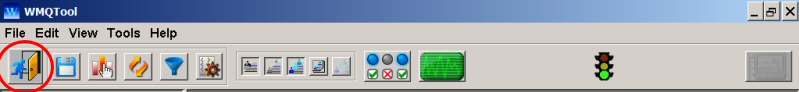
The first button from left is ‘Exit’ button. Click on this button and WMQTool will do normal termination by closing all connections to queues and disconnecting all queue managers. You can also close the tool by clicking on ‘x’ button on right top corner or by selecting File and then Exit from the menu at the top.
In WMQTool, when you close the tool, it remembers the last connected queue manager and the style of look and feel of the GUI. It means, when you again run the WMQTool, it will display with same look & feel, Windows, Motif or Java and the selection will be on the same queue manager when it was at the time of last close down. Look & Feel can be changed by selecting View in the menu at the top and then any of the three look and feels.
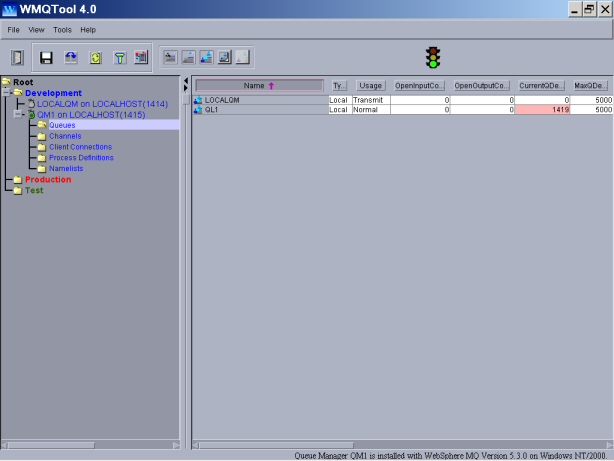
Here is a view of look & feel in Motif.
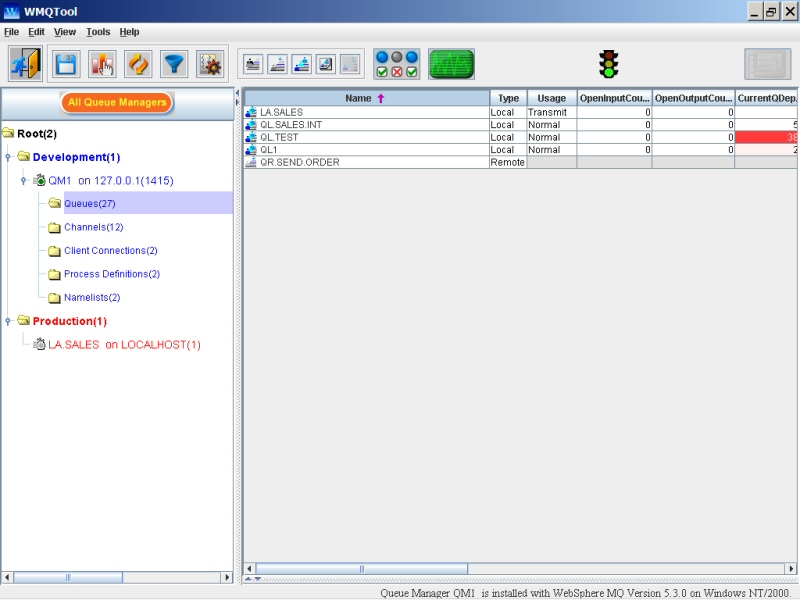
This is an example of Java look & feel.
There are two sections of tool bar.
Permanent.
Temporary.
Permanent section:
In Permanent section, there are 5 buttons.
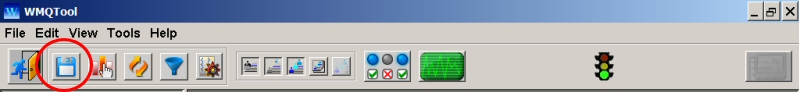
Save settings:![]() This button saves all the settings like connection information,
queue, channel, process definition, client connection and namelist columns
selection permanently. It also saves all the information about Filter to
separate queue manager files. So whenever you start the WMQTool, it will
automatically set according to these settings.
This button saves all the settings like connection information,
queue, channel, process definition, client connection and namelist columns
selection permanently. It also saves all the information about Filter to
separate queue manager files. So whenever you start the WMQTool, it will
automatically set according to these settings.
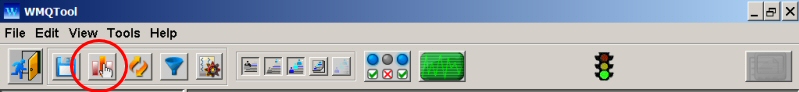
Select columns:![]() You may
want to select and reorder columns of any of the views of Queues, Channels,
Process Definitions, Client Connections or Namelists. WMQTool will remember it
through out the session. If you want WMQTool to remember it permanently, click
on ‘Save settings’ button, just mentioned above.
You may
want to select and reorder columns of any of the views of Queues, Channels,
Process Definitions, Client Connections or Namelists. WMQTool will remember it
through out the session. If you want WMQTool to remember it permanently, click
on ‘Save settings’ button, just mentioned above.
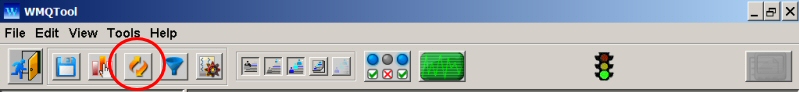
Refresh: ![]() By
clicking this button, you can refresh the current view which may be any of the
five, Queues, Channels, Process Definitions, Client Connections or Namelists.
By
clicking this button, you can refresh the current view which may be any of the
five, Queues, Channels, Process Definitions, Client Connections or Namelists.
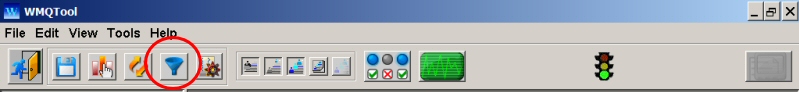
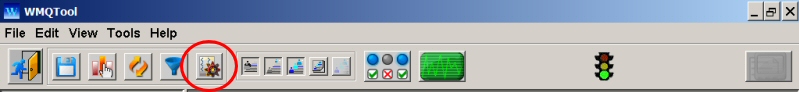
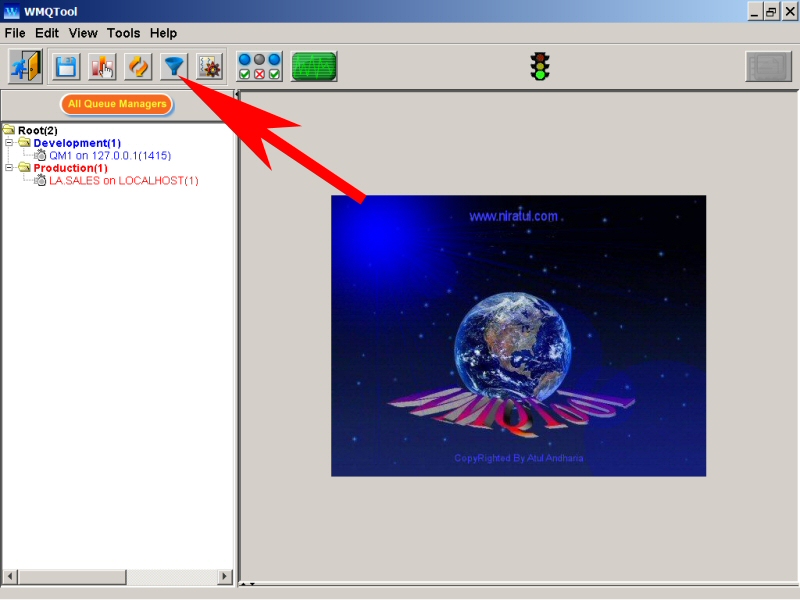
Filter:![]() This
is a new addition in WMQTool 2.0. Now you can have filtered view of all objects
– queues, channels, process definitions, client connections and namelists. More
detail about the Filter button is provided below in ‘Filtering Objects’
section.
This
is a new addition in WMQTool 2.0. Now you can have filtered view of all objects
– queues, channels, process definitions, client connections and namelists. More
detail about the Filter button is provided below in ‘Filtering Objects’
section.
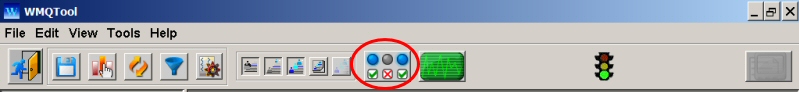
System objects:![]() It is a
toggling button and by selecting it, you can make the system objects of current
view visible. For example, if the current view is of ‘Queues’, by selecting
this button will make all the ‘System’ queues visible. Unselecting this button
will hide the system objects.
It is a
toggling button and by selecting it, you can make the system objects of current
view visible. For example, if the current view is of ‘Queues’, by selecting
this button will make all the ‘System’ queues visible. Unselecting this button
will hide the system objects.
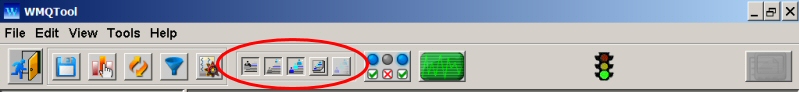
Temporary Section:
In this section, a panel of buttons becomes visible on selection of certain entries on left window. These panels are having certain number of buttons used to filter the view on right hand window. There are two types of panels.
1. Queue panel
2. Channel panel
Queue Panel:
You can selectively create the list of queues by using buttons in Queue Panel in Tool Bar. There are 5 buttons provided in Tool Bar pertaining to 5 different types of queues.
Alias queues
![]()
Remote queues
![]()
Local queues
![]()
Model queues
![]()
Temp queues.
![]()
Whatever button is selected, that type of queues are displayed. By default, Alias, Remote and Local queues’ buttons are selected. You may select/deselect any combination of the queues depending upon your requirements. Because Temp Queues are Local Queues, Temp Queues button will be only activated if Local queues button is selected.
This Queue panel will be visible only when you have selected ‘Queues’ from the left hand window.
In above figure, notice that all the 5 buttons are selected along with the System Objects button.
Channel Panel:
This panel displays buttons to select/deselect 7 types of channels. They are:
Sender
![]()
Server
![]()
Receiver
![]()
Requester
![]()
Server Connection
![]()
Cluster Sender
![]()
Cluster Receiver
![]()
By default, all the channel buttons are selected. You may select any combination of channel buttons depending upon your requirements to filter the view of channels. Only channel types whose buttons are selected, will be displayed.
Channel panel is visible only when the ‘Channels’ is selected on the tree in the left window.
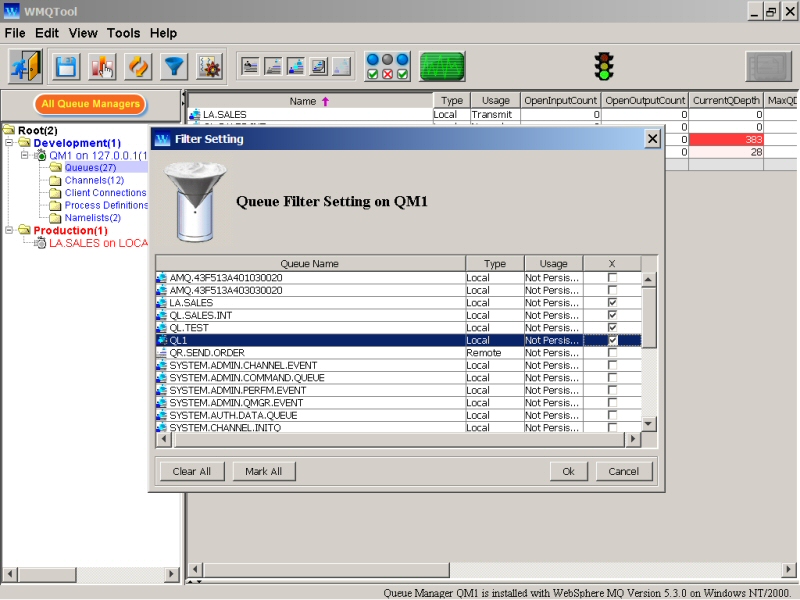
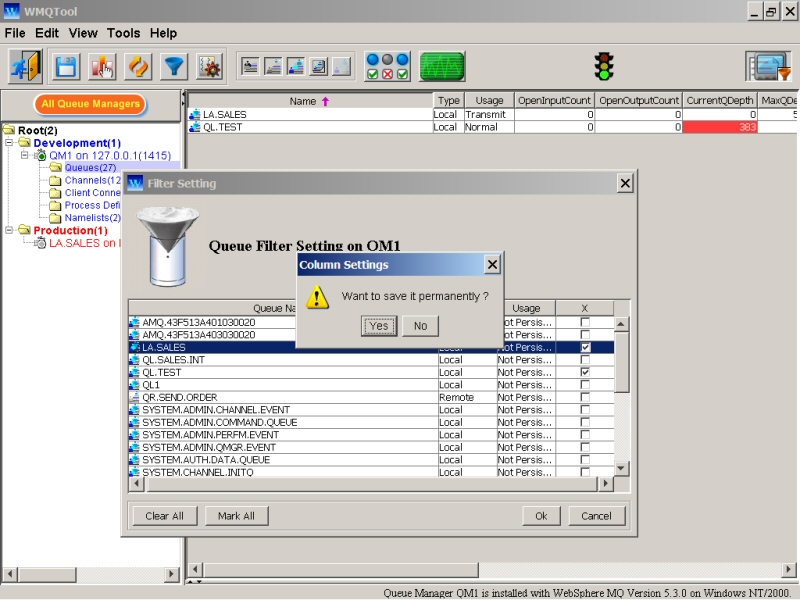
When you click on ‘Filter’ button on the toolbar at the top, a window appears with the list of all the objects currently viewed, including system objects and temporary queues, if queues are selected. So if you have selected ‘Queues’ on the left side tree structure, it will display the window to filter all the queues.
..and if you have selected 'Channels' in the tree, it will allow you to filter 'Channels View'.
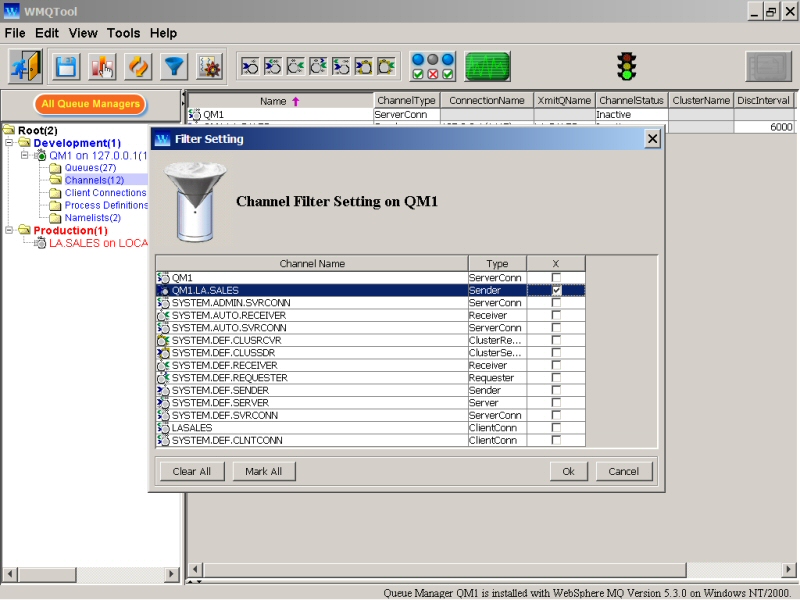
You can click on the object which you want to select. The check box in front of the object name will be marked. To unmark it, click once again on the same object name. The marking from the check box will disappear.
To clear all the markings from all the object names, click on ‘Clear All’ button. To mark all the object names, click on ‘Mark All’ button. But when you select ‘Mark All’ or mark all the object names and then hit ‘Ok’ button, the Filter is removed from that type of objects and ‘Display All’ and ‘Filter’ buttons will disappear! This is because, when you mark all the object names to view, it means that you don’t want to set any filter on that view and want to view all of them.
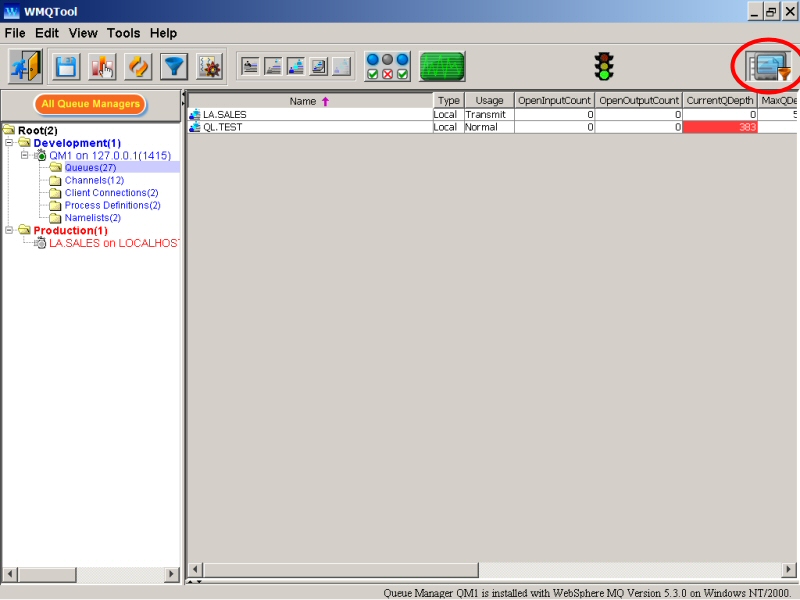
When you have set Filter on any type of objects (queues, channels, process definitions, client connections or namelists), a filter button will appear on the right top corner. It is a toggling button. When it shows a funnel in it, it is filtering the objects. Click on it once and this funnel will disappear and will display all the objects in the view. This is to help you to quickly have a look at all the objects and then setting the ‘Filter’ back again. When you click on ‘Display All’, all the objects in that view are displayed as if there is no filter set. But when you click on ‘Filter’, the filtered list of the objects is displayed.
Filter setting is preserved separate for each queue manager in a file named with the queue manager's connection name and port no.
If you want to save these settings permanently, respond to 'Yes'.
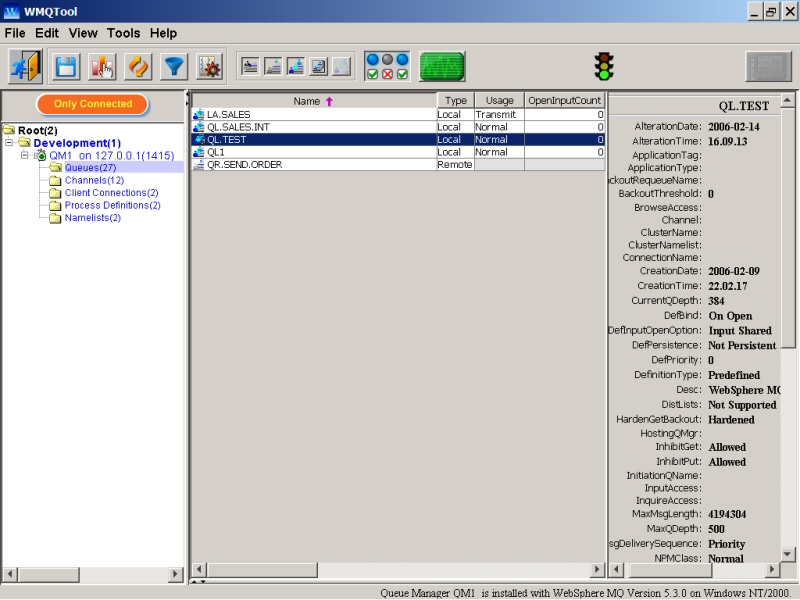
After queues/channels temporary buttons, the Properties button is displayed.
When this button is in pressed (selected) position, a window is opened at the right. If you have selected any object in any view, its properties are displayed.
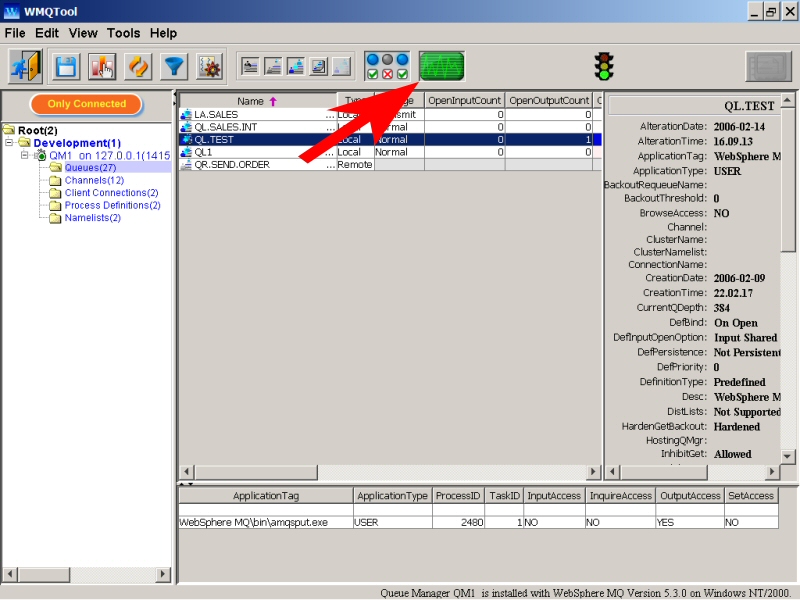
Like Properties button, Status button opens up another window at the bottom.
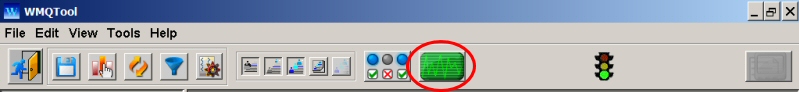
It displays status fields of status of the selected object. It will display in multiple rows if received from queue manager. To select the columns in this window, click on 'Select Columns' in the tool bar.
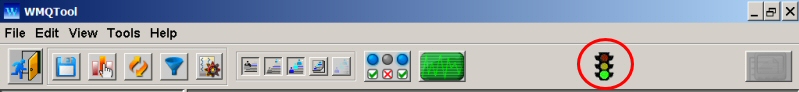
Traffic signal is automatic and it displays two positions. One with green color and another with red color. Green color means you can work with WMQTool in the current window. Red color means WMQTool is waiting waiting on MQ Server to respond for any inquiry OR WMQTool is busy doing some activity OR it is waiting for user response on another window. In any of these circumstances, the main screen freezes. It will be reactivated when the signal turns green.
Filtered Objects Button:
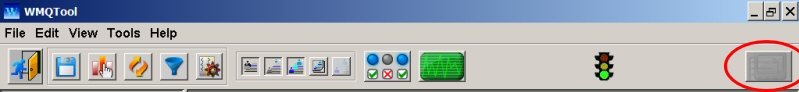
About Filtered Objects button on the right most, we have already described above.